

Wall Street Usually Cuts Its Estimates. This Year, It’s Raising Them.
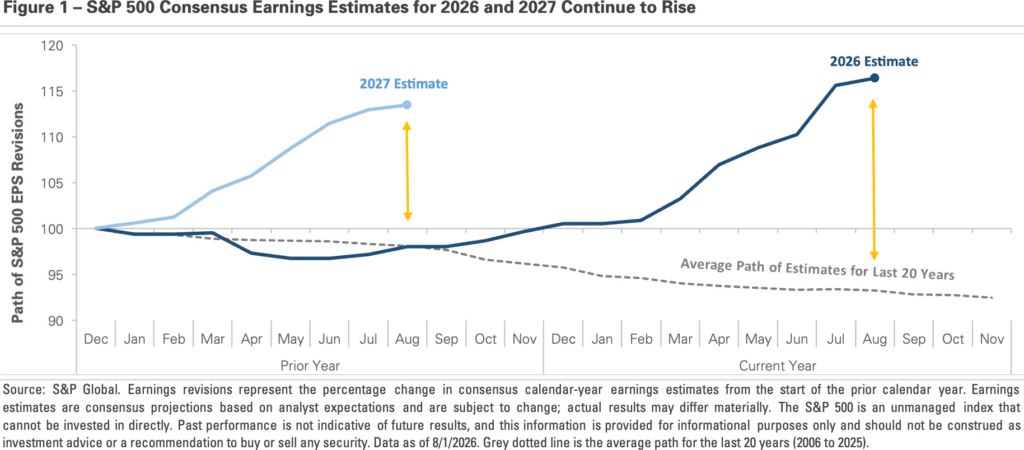
Each year tends to follow a similar script on Wall Street. Analysts start the year optimistic about how much profit companies will earn, then spend the following quarters trimming those forecasts as actual results come in. Figure 1, which tracks the S&P 500 earnings estimates for each calendar year over the prior two years, shows the pattern. As an example, analysts would start tracking 2026 earnings estimates at the start of 2025, two years ahead of time. For comparison purposes, the starting point for each year is set to 100. The gray dashed line shows the average path over the last 20 years. It slopes steadily down and ends about -8% below where it began, highlighting how analysts often revise their estimates to match results and corporate guidance. In contrast, the two darker lines, which graph the estimates for 2026 and 2027, are doing the opposite. Both have risen more than +10% since tracking began. Analysts are raising their estimates this cycle, not cutting, which stands out against two decades of history.
This year is different because actual earnings results have been strong. Analysts have consistently raised their estimates to keep pace with what companies are reporting, with profits repeatedly coming in ahead of expectations. The S&P 500 is on track for its seventh straight quarter of double-digit earnings growth. The technology sector is a major contributor, as heavy investment in artificial intelligence produces sales and earnings growth, but the strength reaches beyond it as well. More than 85% of S&P 500 companies have beaten their Q2 earnings estimates, above the five-year average of 78%. The strength is even more notable given the backdrop, which includes the Middle East conflict, volatile oil prices, and lingering inflation.
The stock market’s strong returns in recent years have been powered by real earnings growth, not just investor enthusiasm. The chart shows that analysts expect the strength to continue, with forecasts calling for another year of double-digit earnings growth in 2027. Much of the outlook rests on the AI buildout, where the largest tech companies are expected to continue spending heavily on infrastructure. Analysts also point to the wider economy, with expectations for steady economic growth and a productivity boost as more companies implement AI in their operations. However, none of this guarantees a smooth ride. When expectations run this far above normal, they set a high bar. Companies now have to deliver on forecasts that already assume a lot of good news. Volatility along the way is almost certain, but it’s the price of admission for the returns stocks provide. For long-term investors, the point is simple: prices follow earnings, not headlines.
Important Disclosures
Published by Market Desk Research and distributed by QuadCap Wealth Management, LLC.
This client letter is being furnished by QuadCap Wealth Management, LLC (“QuadCap”) on a confidential basis for the exclusive use of clients of QuadCap. and may not be disseminated, communicated, reproduced, redistributed or otherwise disclosed by the recipient to any other person without the prior written consent of QuadCap.
This document does not constitute an offer, solicitation or recommendation to sell or an offer to buy any securities, investment products or investment advisory services. Such an offer may only be made to prospective investors by means of delivery of an investment advisory agreement, subscription agreement and other similar materials that contain a description of the material terms relating to such investment, investment strategy or service. This presentation is being provided for general informational purposes only.
This presentation includes information based on data found in independent industry publications and other sources and is current as of the date of this presentation. Although we believe that the data is reliable, we have not sought, nor have we received, permission from any third-party to include their information in this presentation. Charts, tables and graphs contained in this document are not intended to be used to assist the reader in determining which securities to buy or sell or when to buy or sell securities. Opinions, estimates, and projections constitute the current judgment of QuadCap and are subject to change without notice.
Investing involves risk, including the potential loss of principal. Past performance is not indicative of future results and there can be no assurance that the future performance of any specific investment or investment strategy will be profitable or equal to any corresponding index or benchmark. The information provided is for informational purposes only and does not constitute investment advice, an offer to sell, or a solicitation to buy any security. Investors should carefully consider their investment objectives, risk tolerance, time horizon, and liquidity needs before investing. Please consult a qualified financial advisor before making any investment decisions. The performance information shown herein is based on total returns with dividends reinvested and does not reflect the deduction of advisory and/or other fees normally incurred in the management of a portfolio. The principal risks are: common stock risk, emerging market risk, focused portfolio risk, foreign country risk, foreign currency risk.
Advisory Services are offered through QuadCap, an SEC registered investment advisor. QuadCap only transacts business in states where it is properly registered or is excluded or exempted from registration requirements. SEC registration is not an endorsement of the firm by the Commission and does not mean that QuadCap has attained a specific level of skill or ability.
References to any indices are for informational and general comparative purposes only. There are significant differences between such indices and the investment programs described in this presentation. References to indices do not suggest that the investment programs will, or are likely to, achieve returns, volatility, or other results similar to such indices. The performance data of various indices presented herein was current as of the date of the presentation. Indices are unmanaged, unavailable for direct investment, and do not reflect the deduction of fees and expenses.
The S&P 500 Index or Standard & Poor’s 500 Index is a market-capitalization-weighted index of 500 leading publicly traded companies in the U.S.
The Russell 2000 index measures the performance of approximately 2,000 small-cap US equities.
The MSCI EAFE Index is a stock market index that measures the performance of large- and mid-cap companies across 21 developed markets countries around the world. Canada and the USA are not included.
The MSCI Emerging Markets Index captures large and mid-cap representation across 24 Emerging Markets (EM) countries.
The Nasdaq 100 Index is a stock index of the 100 largest companies by modified market capitalization trading on Nasdaq exchanges.
The Russell 1000 Growth index is an index that tracks large cap, growth stocks. This benchmark is important for investors that might tilt their investments towards large cap growth. Growth stocks, in comparison to value stocks, are considered companies with a more growth potential, and a higher risk profile.
The Russell 1000 Value index is an index that tracks large cap, value stocks. This benchmark is important for investors that might tilt their investments towards large cap value. Value stocks, in comparison to growth stocks, are considered companies with a stable cash flow, and more mature business model.
The Dow Jones Industrial Average, or simply the Dow, is a stock market index that indicates the value of 30 large, publicly owned companies based in the United States, and how they have traded in the stock market during various periods of time. These 30 companies are also included in the S&P 500 Index. The value of the Dow is not a weighted arithmetic mean and does not represent its component companies’ market capitalization, but rather the sum of the price of one share of stock for each component company. The sum is corrected by a factor which changes whenever one of the component stocks has a stock split or stock dividend, so as to generate a consistent value for the index.
The Bloomberg US Aggregate Bond Index is used as a benchmark for investment grade bonds within the United States. This index is important as a benchmark for someone wanting to track their fixed income asset allocation.
The Bloomberg US Corporate Index covers performance for United States corporate bonds. This index serves as an important benchmark for portfolios that include exposure to investment grade corporate bonds.
The Bloomberg US Corporate High Yield Index covers performance for United States high yield corporate bonds. This index serves as an important benchmark for portfolios that include exposure to riskier corporate bonds that might not necessarily be investment grade.
Treasuries, also known as Treasury securities, are debt obligations issued by the United States government. They are used to raise cash needed to fund government operations and help finance the federal deficit. Treasuries are backed by the full faith and credit of the US government, making them one of the safest investments. They are an important instrument in monetary policy, allowing central banks to control the money supply.
The Prime Rate is the interest rate that commercial banks charge their most creditworthy corporate customers. The prime rate is derived from the federal funds rate, usually using fed funds + 3 as the formula.