Stocks Set New Highs as Geopolitical Tensions Ease
Monthly Market Summary
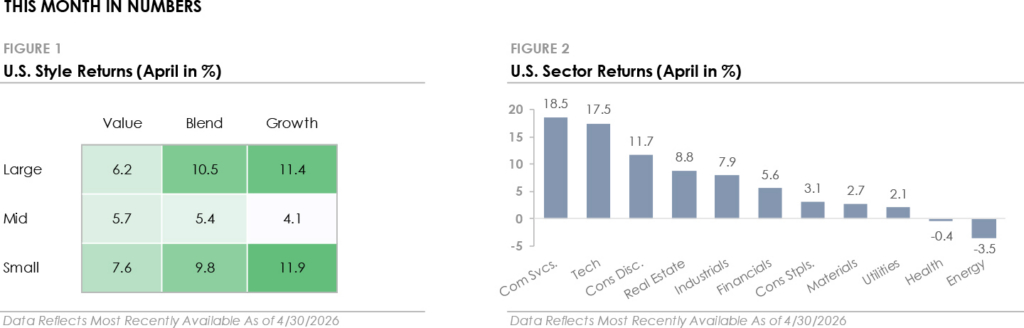
- The S&P 500 Index gained +10.5% in April, recovering its March decline and setting a new high. Communication Services led all S&P 500 sectors with a +18.5% return, followed by Technology (+17.5%) and Consumer Discretionary (+11.7%). Nine of eleven sectors traded higher as stocks recovered from the March selloff, but eight sectors underperformed the index as mega-cap stocks drove the bulk of the gains.
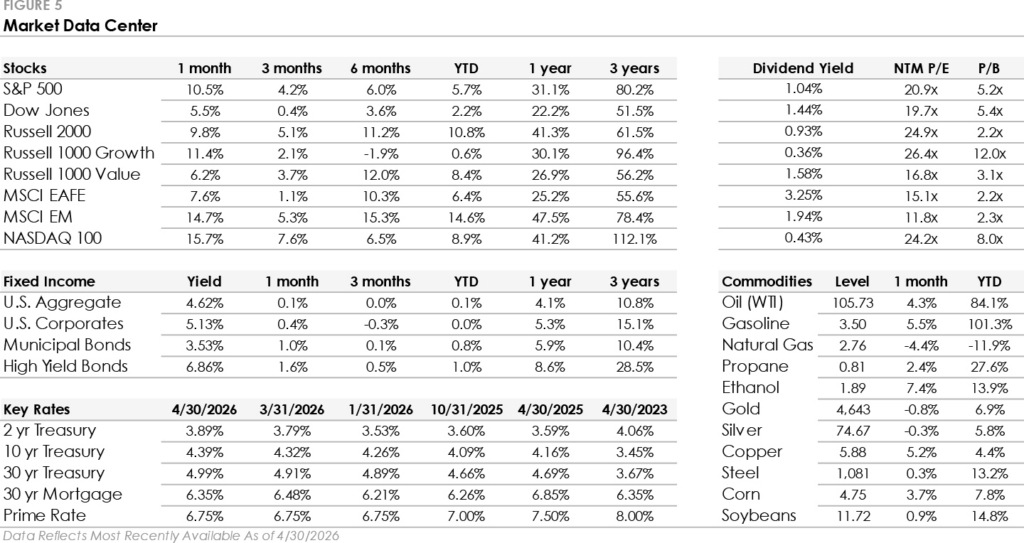
- Bonds traded lower as Treasury yields rose during the month. The U.S. Bond Aggregate returned +0.1% and underperformed corporate bonds as credit spreads tightened. High-yield’s +1.6% total return outpaced investment-grade’s +0.4% return as credit spread tightening benefited lower-quality bonds.
- International stocks underperformed the S&P 500 as U.S. Growth stocks led during the recovery. Emerging markets gained +14.7% and outperformed developed markets’ +7.6% return, with energy-importing regions like Europe and Japan impacted by the continued oil supply disruption.
Markets Rebound as Geopolitical Tensions Ease
Back-to-back ceasefires, first between the U.S. and Iran on April 7 and then between Israel and Lebanon on April 16, changed the market’s outlook. The agreements removed the worst-case scenario, and the reversal was immediate across markets. The S&P 500 erased all its March losses and went on to set a new all-time high by month-end. The Dow surged over 1,300 points the day the U.S.-Iran ceasefire took effect, its best day in a year. The Nasdaq Index gained nearly +16% during the month, driven by a historic semiconductor rally, and the Russell 2000 small-cap index gained +9.8% and set its own record. The recovery also reached beyond stocks. Credit spreads, which reflect how concerned the bond market is about corporate borrowers, reversed three months of widening in four weeks, and market uncertainty, as measured by the VIX Index, fell to pre-conflict levels.
The relief was broad and fast, but the underlying situation remains unsettled. The Strait of Hormuz, which carries roughly 20% of global oil supply, remains effectively closed, with only a few tankers crossing daily compared to hundreds before the conflict. Oil prices fell sharply on the ceasefire announcements, including the largest single-day decline since 2020, but have since risen back above $100 per barrel. Gasoline remained above $4 a gallon throughout April, and consumer confidence fell to its lowest reading in the University of Michigan survey’s 70-year history. The ceasefires reduced fears of further near-term escalation, and investors moved quickly to price that in. However, the oil supply disruption that’s become a part of the conflict has not been resolved.
AI Is Benefitting Some Companies More Than Others Within the Tech Sector
The technology sector gained nearly +18% in April, but the gap between its strongest and weakest corners was wide. The divergence is being driven by artificial intelligence, which is simultaneously fueling demand in one part of the sector and raising fundamental questions about another. AI requires massive upfront investment to build and operate, including computer chips, data centers, power generation, and networking equipment. The companies that build the infrastructure are seeing a surge in demand as the physical backbone behind AI is constructed. At the same time, AI is advancing to the point where it can perform tasks that traditionally require human users interacting with software. AI agents, automated systems that can handle workflows like customer service, data entry, and internal reporting, are raising questions about the future of enterprise software.
The divergence could be seen in markets during April. Semiconductor stocks, which sell computer chips, rose more than +40% over 17 consecutive trading days, the longest uninterrupted winning streak for the group dating back to the early 1990s. Semiconductor funds absorbed $5.5 billion in new investment during the month, and earnings results from major chipmakers confirmed that infrastructure spending is translating into revenue growth. Enterprise software moved in the opposite direction. Several of the largest names in the industry have declined more than -30% this year, and the selling has even hit companies that beat earnings estimates and raised their forward guidance. The divergence comes as the market works through which business models AI will enhance and which it will disrupt. It’s a question likely to define not only the technology sector but also the broader market for some time.
This Month in Numbers
Important Disclosures
Published by Market Desk Research and distributed by QuadCap Wealth Management, LLC.
This client letter is being furnished by QuadCap Wealth Management, LLC (“QuadCap”) on a confidential basis for the exclusive use of clients of QuadCap. and may not be disseminated, communicated, reproduced, redistributed or otherwise disclosed by the recipient to any other person without the prior written consent of QuadCap.
This document does not constitute an offer, solicitation or recommendation to sell or an offer to buy any securities, investment products or investment advisory services. Such an offer may only be made to prospective investors by means of delivery of an investment advisory agreement, subscription agreement and other similar materials that contain a description of the material terms relating to such investment, investment strategy or service. This presentation is being provided for general informational purposes only.
This presentation includes information based on data found in independent industry publications and other sources and is current as of the date of this presentation. Although we believe that the data are reliable, we have not sought, nor have we received, permission from any third-party to include their information in this presentation. Charts, tables and graphs contained in this document are not intended to be used to assist the reader in determining which securities to buy or sell or when to buy or sell securities. Opinions, estimates, and projections constitute the current judgment of QuadCap and are subject to change without notice.
References to any indices are for informational and general comparative purposes only. There are significant differences between such indices and the investment programs described in this presentation. References to indices do not suggest that the investment programs will, or are likely to, achieve returns, volatility, or other results similar to such indices. The performance data of various indices presented herein was current as of the date of the presentation.
Past performance is not indicative of future results and there can be no assurance that the future performance of any specific investment or investment strategy will be profitable or equal any corresponding index or benchmark. The performance information shown herein is based on total returns with dividends reinvested and does not reflect the deduction of advisory and/or other fees normally incurred in the management of a portfolio. Stock performance and fundamental data is based on the following instruments: SPDR S&P 500 ETF (SPY), SPDR Dow Jones ETF (DIA), iShares Russell 2000 ETF (IWM), iShares Russell 1000 Growth ETF (IWF), iShares Russell 1000 Value ETF (IWD), iShares MSCI EAFE ETF (EFA), iShares MSCI Emerging Markets ETF (EEM), Invesco QQQ Trust (QQQ). Fixed Income performance is based on the following instruments: iShares Core U.S. Aggregate Bond ETF (AGG), iShares Investment Grade Corporate ETF (LQD), iShares National Muni Bond ETF (MUB), iShares High Yield Corporate ETF (HYG). Fixed Income yields and key rates are based on the following instruments: Bloomberg US Aggregate, ICE BofA US Corporate, ICE BofA US Municipal Securities, ICE BofA US High Yield, 2 Year US Benchmark Bond, 10 Year US Benchmark Bond, 30 Year US Benchmark Bond, 30 Year US Fixed Mortgage Rate, US Prime Rate. Commodity prices are based on the following instruments: Crude Oil WTI (NYM $/bbl), Gasoline Regular U.S. Gulf Coast ($/gal), Natural Gas (NYM $/mmbtu), Propane (NYM $/gal), Ethanol (CRB $/gallon), Gold (NYM $/ozt), Silver (NYM $/ozt), Copper NYMEX ($/lb), U.S. Midwest Domestic Hot-Rolled Coil Steel (NYM $/st), Corn (CBT $/bu), Soybeans (Chicago $/bu). U.S. Style performance is based on the following instruments: iShares Russell 1000 Value ETF (IWD), SPDR S&P 500 ETF Trust (SPY), iShares Russell 1000 Growth ETF (IWF), iShares Russell Mid-Cap Value ETF (IWS), iShares Russell Midcap ETF (IWR), iShares Russell Mid-Cap Growth ETF (IWP), iShares Russell 2000 Value ETF (IWN), iShares Russell 2000 ETF (IWM), iShares Russell 2000 Growth ETF (IWO). U.S. Sector performance is based on the following instruments: Consumer Discretionary Sector SPDR ETF (XLY), Consumer Staples Sector SPDR ETF (XLP), Energy Sector SPDR ETF (XLE), Financial Sector SPDR ETF (XLF), Health Care Sector SPDR ETF (XLV), Industrial Sector SPDR ETF (XLI), Materials Sector SPDR ETF (XLB), Technology Sector SPDR ETF (XLK), Communication Services Sector SPDR ETF (XLC), Utilities Sector SPDR ETF (XLU), Real Estate Sector SPDR ETF (XLRE).
Advisory Services are offered through QuadCap, an SEC registered investment advisor. QuadCap only transacts business in states where it is properly registered or is excluded or exempted from registration requirements. SEC registration is not an endorsement of the firm by the Commission and does not mean that QuadCap has attained a specific level of skill or ability.
The S&P 500 Index or Standard & Poor’s 500 Index is a market-capitalization-weighted index of 500 leading publicly traded companies in the U.S.
The Russell 2000 index measures the performance of approximately 2,000 small-cap US equities.
The MSCI EAFE Index is a stock market index that measures the performance of large- and mid-cap companies across 21 developed markets countries around the world. Canada and the USA are not included.
The MSCI Emerging Markets Index captures large and mid cap representation across 24 Emerging Markets (EM) countries.
The Nasdaq 100 Index is a stock index of the 100 largest companies by modified market capitalization trading on Nasdaq exchanges.
The Russell 1000 Growth index is an index that tracks large cap, growth stocks. This benchmark is important for investors that might tilt their investments towards large cap growth. Growth stocks, in comparison to value stocks, are considered companies with a more growth potential, and a higher risk profile.
The Russell 1000 Value index is an index that tracks large cap, value stocks. This benchmark is important for investors that might tilt their investments towards large cap value. Value stocks, in comparison to growth stocks, are considered companies with a stable cash flow, and more mature business model.
The Dow Jones Industrial Average, or simply the Dow, is a stock market index that indicates the value of 30 large, publicly owned companies based in the United States, and how they have traded in the stock market during various periods of time. These 30 companies are also included in the S&P 500 Index. The value of the Dow is not a weighted arithmetic mean and does not represent its component companies’ market capitalization, but rather the sum of the price of one share of stock for each component company. The sum is corrected by a factor which changes whenever one of the component stocks has a stock split or stock dividend, so as to generate a consistent value for the index.
The Bloomberg US Aggregate Bond Index is used as a benchmark for investment grade bonds within the United States. This index is important as a benchmark for someone wanting to track their fixed income asset allocation.
The Bloomberg US Corporate Index covers performance for United States corporate bonds. This index serves as an important benchmark for portfolios that include exposure to investment grade corporate bonds.
The Bloomberg US Corporate High Yield Index covers performance for United States high yield corporate bonds. This index serves as an important benchmark for portfolios that include exposure to riskier corporate bonds that might not necessarily be investment grade.
Treasuries, also known as Treasury securities, are debt obligations issued by the United States government. They are used to raise cash needed to fund government operations and help finance the federal deficit. Treasuries are backed by the full faith and credit of the US government, making them potentially one of the safest investments. They are an important instrument in monetary policy, allowing central banks to control the money supply.
The Prime Rate is the interest rate that commercial banks charge their most creditworthy corporate customers. The prime rate is derived from the federal funds rate, usually using fed funds + 3 as the formula.