Stocks Trade Higher as Market Leadership Broadens
Monthly Market Summary
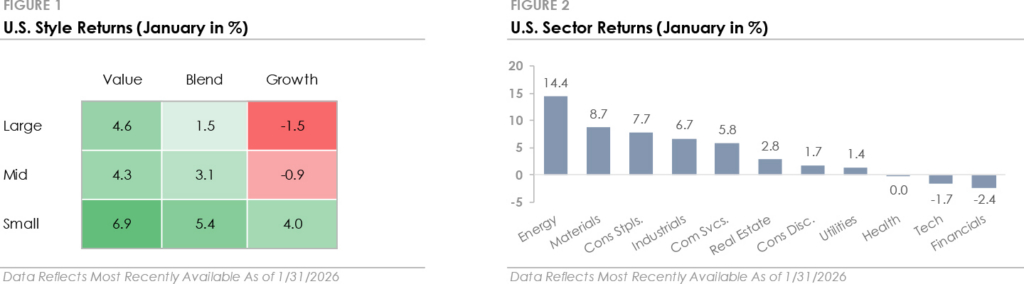
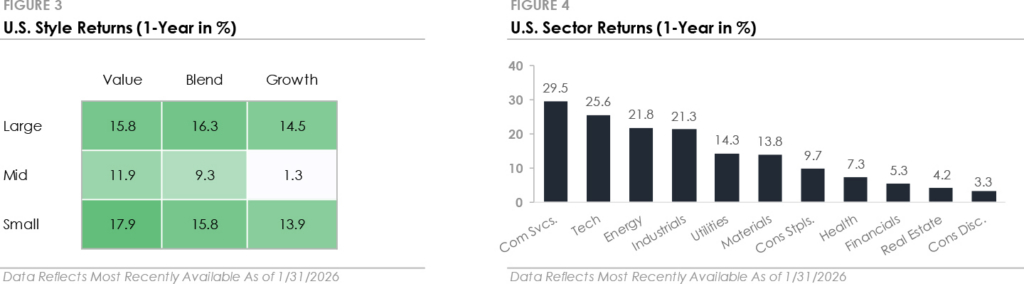
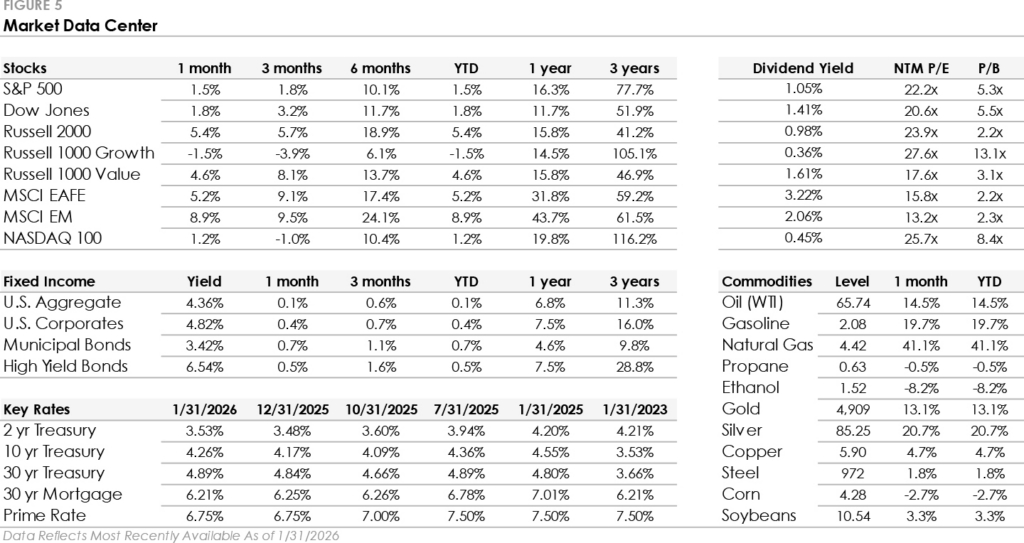
- The S&P 500 Index gained +1.5% in January, setting a new high as it traded above 7,000 for the first time. Large Cap Growth declined -1.5% as tech stocks traded lower, while Large Cap Value rose +4.6%. The Russell 2000 returned +5.4% and set new highs as market leadership rotated toward smaller companies.
- Energy led all S&P 500 sectors with a +14.4% return as oil prices rose nearly +15%. Seven of the eleven S&P 500 sectors outperformed the index, while the Financials, Technology, and Health Care sectors each traded lower.
- Bonds produced modest gains despite rising Treasury yields, with the U.S. Bond Aggregate gaining +0.1%. Corporate bonds outperformed as credit spreads tightened, with investment-grade gaining +0.4% and high-yield returning +0.5%.
- International stocks outperformed the S&P 500 as the U.S. dollar fell to a nearly 4-year low. Developed Markets gained +5.2%, outperforming the S&P 500 but underperforming Emerging Markets’ +8.9% return.
Economic Activity Remains Solid Despite Weak Sentiment
Economic data continues to highlight a widening gap between how people feel and how the economy is performing. Measures of real activity, such as retail sales and industrial production, indicate the economy ended 2025 with solid momentum. In contrast, consumer confidence fell to multi-year lows, driven by concerns about inflation, job security, and geopolitical uncertainty, and an index of manufacturing conditions remained in contraction. The gap between sentiment and behavior has been a recurring theme over the past 12 months. Despite weak consumer and business confidence, data that measures actual spending and economic activity is supportive of continued growth.
Treasury Yields Rise as the Fed Pauses its Rate-Cutting Cycle Again
Treasury yields rose in January in anticipation that the Federal Reserve would pause its rate-cutting cycle. The shift was driven by better-than-expected economic data and signs of stabilization in the labor market. While job growth continued to slow and the number of job openings fell, unemployment unexpectedly declined and jobless claims remained low. The data points to a continued hiring slowdown, but the lack of widespread layoffs signals underlying stability. Overall, January’s economic data offered little new information on inflation or growth, which allows the Fed to remain patient.
As anticipated, the Fed held interest rates steady at its late January meeting, ending a streak of three consecutive 0.25% cuts in late 2025. The policy statement struck a more optimistic tone compared to recent months, describing consumer spending and business activity as solid despite disruptions from the Q4 government shutdown. The Fed’s decision and commentary signal a wait-and-see approach as policymakers assess the lagged impact of last year’s cuts. Based on pricing in futures markets, the next rate cut isn’t expected until June.
Market Leadership Broadens & Commodity Prices Spike
Two market themes defined the month. First, market leadership shifted away from mega-cap technology stocks. Major indexes traded higher, but the average stock outperformed the index. The equal-weighted S&P 500 outperformed the traditional market-cap-weighted index, small-cap stocks outperformed the S&P 500 by nearly +4%, and the Value factor outperformed the Growth factor by over +5%. The rotation is a significant change after a small group of mega-cap stocks drove a large portion of the stock market’s recent gains. The shift is attributed to an improving economic outlook and a catch-up trade, as expensive mega-cap technology valuations prompt a rotation into more traditional, domestically focused companies that will benefit from lower interest rates and trade at more attractive valuations.
The second theme was a sharp rally in the commodity market. Despite late month volatility, gold rose +10% to a new high, silver surged over +20% to a new high, and oil prices rose to the highest level since last September. Investors turned to commodities as a hedge against global uncertainty, driven by geopolitical tensions, policy uncertainty, and a weaker U.S. dollar. The strength in commodity markets made Energy and Materials the top two performing sectors. This year’s start, with the stock market rotation and commodity rally, highlights how portfolio diversification can help smooth results when leadership shifts.
This Month in Numbers
Important Disclosures
Published by Market Desk Research and distributed by QuadCap Wealth Management, LLC.
This client letter is being furnished by QuadCap Wealth Management, LLC (“QuadCap”) on a confidential basis for the exclusive use of clients of QuadCap. and may not be disseminated, communicated, reproduced, redistributed or otherwise disclosed by the recipient to any other person without the prior written consent of QuadCap.
This document does not constitute an offer, solicitation or recommendation to sell or an offer to buy any securities, investment products or investment advisory services. Such an offer may only be made to prospective investors by means of delivery of an investment advisory agreement, subscription agreement and other similar materials that contain a description of the material terms relating to such investment, investment strategy or service. This presentation is being provided for general informational purposes only.
This presentation includes information based on data found in independent industry publications and other sources and is current as of the date of this presentation. Although we believe that the data are reliable, we have not sought, nor have we received, permission from any third-party to include their information in this presentation. Charts, tables and graphs contained in this document are not intended to be used to assist the reader in determining which securities to buy or sell or when to buy or sell securities. Opinions, estimates, and projections constitute the current judgment of QuadCap and are subject to change without notice.
References to any indices are for informational and general comparative purposes only. There are significant differences between such indices and the investment programs described in this presentation. References to indices do not suggest that the investment programs will, or are likely to, achieve returns, volatility, or other results similar to such indices. The performance data of various indices presented herein was current as of the date of the presentation.
Past performance is not indicative of future results and there can be no assurance that the future performance of any specific investment or investment strategy will be profitable or equal any corresponding index or benchmark. The performance information shown herein is based on total returns with dividends reinvested and does not reflect the deduction of advisory and/or other fees normally incurred in the management of a portfolio. Stock performance and fundamental data is based on the following instruments: SPDR S&P 500 ETF (SPY), SPDR Dow Jones ETF (DIA), iShares Russell 2000 ETF (IWM), iShares Russell 1000 Growth ETF (IWF), iShares Russell 1000 Value ETF (IWD), iShares MSCI EAFE ETF (EFA), iShares MSCI Emerging Markets ETF (EEM), Invesco QQQ Trust (QQQ). Fixed Income performance is based on the following instruments: iShares Core U.S. Aggregate Bond ETF (AGG), iShares Investment Grade Corporate ETF (LQD), iShares National Muni Bond ETF (MUB), iShares High Yield Corporate ETF (HYG). Fixed Income yields and key rates are based on the following instruments: Bloomberg US Aggregate, ICE BofA US Corporate, ICE BofA US Municipal Securities, ICE BofA US High Yield, 2 Year US Benchmark Bond, 10 Year US Benchmark Bond, 30 Year US Benchmark Bond, 30 Year US Fixed Mortgage Rate, US Prime Rate. Commodity prices are based on the following instruments: Crude Oil WTI (NYM $/bbl), Gasoline Regular U.S. Gulf Coast ($/gal), Natural Gas (NYM $/mmbtu), Propane (NYM $/gal), Ethanol (CRB $/gallon), Gold (NYM $/ozt), Silver (NYM $/ozt), Copper NYMEX ($/lb), U.S. Midwest Domestic Hot-Rolled Coil Steel (NYM $/st), Corn (CBT $/bu), Soybeans (Chicago $/bu). U.S. Style performance is based on the following instruments: iShares Russell 1000 Value ETF (IWD), SPDR S&P 500 ETF Trust (SPY), iShares Russell 1000 Growth ETF (IWF), iShares Russell Mid-Cap Value ETF (IWS), iShares Russell Midcap ETF (IWR), iShares Russell Mid-Cap Growth ETF (IWP), iShares Russell 2000 Value ETF (IWN), iShares Russell 2000 ETF (IWM), iShares Russell 2000 Growth ETF (IWO). U.S. Sector performance is based on the following instruments: Consumer Discretionary Sector SPDR ETF (XLY), Consumer Staples Sector SPDR ETF (XLP), Energy Sector SPDR ETF (XLE), Financial Sector SPDR ETF (XLF), Health Care Sector SPDR ETF (XLV), Industrial Sector SPDR ETF (XLI), Materials Sector SPDR ETF (XLB), Technology Sector SPDR ETF (XLK), Communication Services Sector SPDR ETF (XLC), Utilities Sector SPDR ETF (XLU), Real Estate Sector SPDR ETF (XLRE).
Advisory Services are offered through QuadCap, an SEC registered investment advisor. QuadCap only transacts business in states where it is properly registered or is excluded or exempted from registration requirements. SEC registration is not an endorsement of the firm by the Commission and does not mean that QuadCap has attained a specific level of skill or ability.
The S&P 500 Index or Standard & Poor’s 500 Index is a market-capitalization-weighted index of 500 leading publicly traded companies in the U.S.
The Russell 2000 index measures the performance of approximately 2,000 small-cap US equities.
The MSCI EAFE Index is a stock market index that measures the performance of large- and mid-cap companies across 21 developed markets countries around the world. Canada and the USA are not included.
The MSCI Emerging Markets Index captures large and mid cap representation across 24 Emerging Markets (EM) countries.
The Nasdaq 100 Index is a stock index of the 100 largest companies by modified market capitalization trading on Nasdaq exchanges.
The Russell 1000 Growth index is an index that tracks large cap, growth stocks. This benchmark is important for investors that might tilt their investments towards large cap growth. Growth stocks, in comparison to value stocks, are considered companies with a more growth potential, and a higher risk profile.
The Russell 1000 Value index is an index that tracks large cap, value stocks. This benchmark is important for investors that might tilt their investments towards large cap value. Value stocks, in comparison to growth stocks, are considered companies with a stable cash flow, and more mature business model.
The Dow Jones Industrial Average, or simply the Dow, is a stock market index that indicates the value of 30 large, publicly owned companies based in the United States, and how they have traded in the stock market during various periods of time. These 30 companies are also included in the S&P 500 Index. The value of the Dow is not a weighted arithmetic mean and does not represent its component companies’ market capitalization, but rather the sum of the price of one share of stock for each component company. The sum is corrected by a factor which changes whenever one of the component stocks has a stock split or stock dividend, so as to generate a consistent value for the index.
The Bloomberg US Aggregate Bond Index is used as a benchmark for investment grade bonds within the United States. This index is important as a benchmark for someone wanting to track their fixed income asset allocation.
The Bloomberg US Corporate Index covers performance for United States corporate bonds. This index serves as an important benchmark for portfolios that include exposure to investment grade corporate bonds.
The Bloomberg US Corporate High Yield Index covers performance for United States high yield corporate bonds. This index serves as an important benchmark for portfolios that include exposure to riskier corporate bonds that might not necessarily be investment grade.
Treasuries, also known as Treasury securities, are debt obligations issued by the United States government. They are used to raise cash needed to fund government operations and help finance the federal deficit. Treasuries are backed by the full faith and credit of the US government, making them one of the safest investments. They are an important instrument in monetary policy, allowing central banks to control the money supply.
The Prime Rate is the interest rate that commercial banks charge their most creditworthy corporate customers. The prime rate is derived from the federal funds rate, usually using fed funds + 3 as the formula.