

Market Volatility: The Best Days and Worst Days Travel Together
The stock market’s best and worst days tend to arrive together, and the early months of 2026 offered a timely reminder. The S&P 500 fell nearly -10% from its late-January high through the end of March as the U.S.-Iran conflict sent oil prices surging more than +60%. Headlines about the Strait of Hormuz closure, rising energy costs, and the potential economic impact created an environment that can tempt investors to move to cash. But acting on that impulse would have meant missing the recovery that followed when ceasefire talks emerged in late March. It is a well-documented pattern: trying to avoid the worst days often means missing the best days.
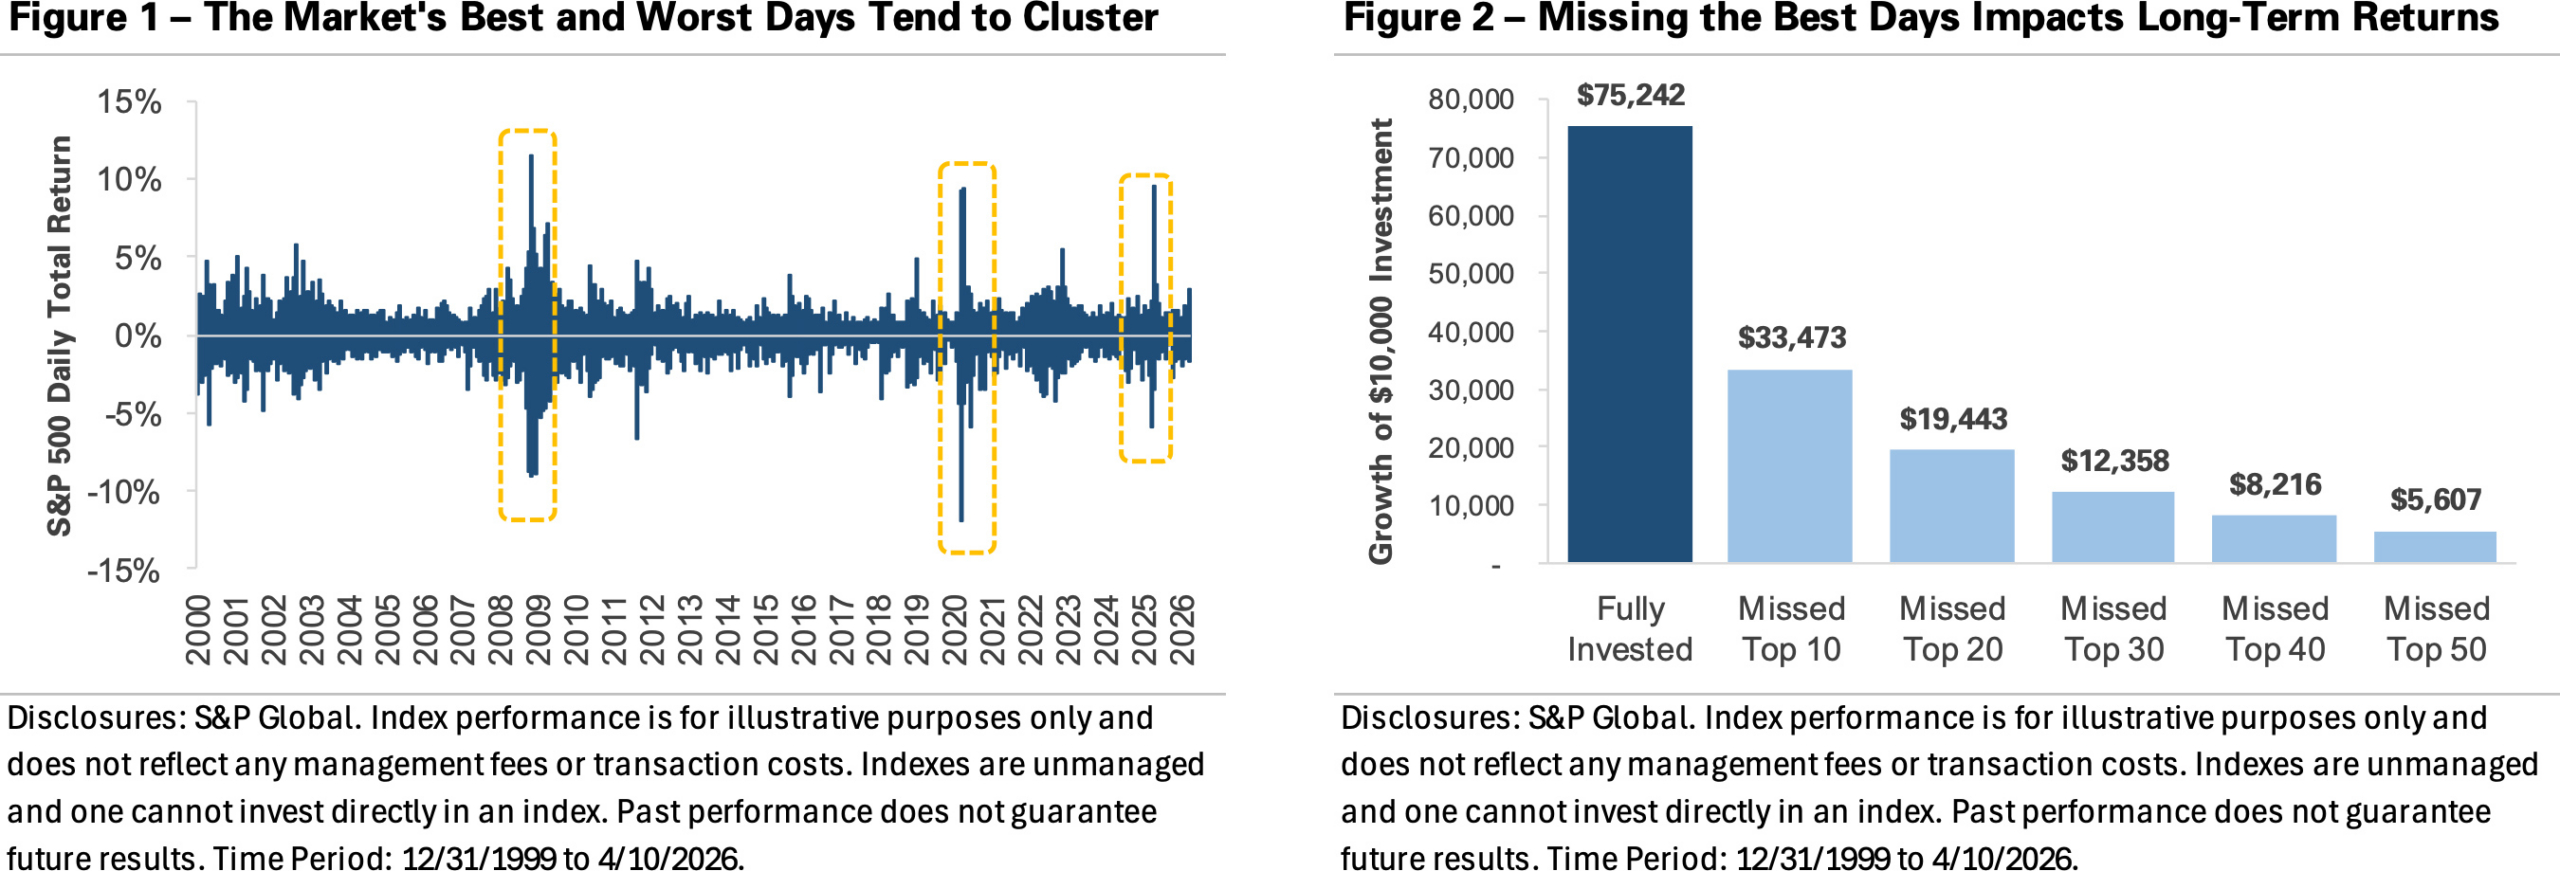
Figure 1 illustrates this dynamic. The chart graphs the S&P 500’s daily returns over the past 26 years, showing that the market’s largest daily moves cluster together rather than occurring in isolation. The biggest single-day selloffs during the 2008 financial crisis, the 2020 pandemic, and the 2025 tariff volatility were each surrounded by some of the largest single-day gains. The pattern showed up again during the recent volatility: the S&P 500 posted its strongest daily return since April 2025 amid optimism for a U.S.-Iran ceasefire, only days after escalating tensions pushed stocks lower. The same environments that produce sharp selloffs often set the stage for strong rallies.
Figure 2 puts a dollar amount on the cost of mistiming the market. A $10,000 investment in the S&P 500 on December 31, 1999, would have grown to $75,242, a more than seven-fold increase over a period that included the dot-com bust, the financial crisis, and a global pandemic. Missing just the 10 best trading days cuts that ending value to $33,473, less than half the fully invested result. The damage compounds quickly from there: missing the top 20 days reduces the value to $19,443, missing the top 30 lowers it to $12,358, and missing the 50 best days shrinks the original $10,000 to $5,607, a loss of more than -40% during a period when the market delivered strong returns.
This year’s market volatility may feel unsettling, but it reinforces a core principle: selling during a decline locks in losses and creates a difficult re-entry problem. Investors who moved to the sidelines during March’s selloff and waited for calmer conditions likely missed a significant portion of the recovery. A well-constructed financial plan accounts for periods of market stress, and strategies like maintaining a diversified portfolio, keeping an appropriate cash reserve, and rebalancing periodically can help investors stay the course. The market rewards patience, and as the first quarter showed, mistiming it can be costly.
Important Disclosures
Published by Market Desk Research and distributed by QuadCap Wealth Management, LLC.
This client letter is being furnished by QuadCap Wealth Management, LLC (“QuadCap”) on a confidential basis for the exclusive use of clients of QuadCap. and may not be disseminated, communicated, reproduced, redistributed or otherwise disclosed by the recipient to any other person without the prior written consent of QuadCap.
This document does not constitute an offer, solicitation or recommendation to sell or an offer to buy any securities, investment products or investment advisory services. Such an offer may only be made to prospective investors by means of delivery of an investment advisory agreement, subscription agreement and other similar materials that contain a description of the material terms relating to such investment, investment strategy or service. This presentation is being provided for general informational purposes only.
This presentation includes information based on data found in independent industry publications and other sources and is current as of the date of this presentation. Although we believe that the data is reliable, we have not sought, nor have we received, permission from any third-party to include their information in this presentation. Charts, tables and graphs contained in this document are not intended to be used to assist the reader in determining which securities to buy or sell or when to buy or sell securities. Opinions, estimates, and projections constitute the current judgment of QuadCap and are subject to change without notice.
References to any indices are for informational and general comparative purposes only. There are significant differences between such indices and the investment programs described in this presentation. References to indices do not suggest that the investment programs will, or are likely to, achieve returns, volatility, or other results similar to such indices. The performance data of various indices presented herein was current as of the date of the presentation.
Investing involves risk, including the potential loss of principal. Past performance is not indicative of future results and there can be no assurance that the future performance of any specific investment or investment strategy will be profitable or equal to any corresponding index or benchmark. The information provided is for informational purposes only and does not constitute investment advice, an offer to sell, or a solicitation to buy any security. Investors should carefully consider their investment objectives, risk tolerance, time horizon, and liquidity needs before investing. Please consult a qualified financial advisor before making any investment decisions. The performance information shown herein is based on total returns with dividends reinvested and does not reflect the deduction of advisory and/or other fees normally incurred in the management of a portfolio.
Advisory Services are offered through QuadCap, an SEC registered investment advisor. QuadCap only transacts business in states where it is properly registered or is excluded or exempted from registration requirements. SEC registration is not an endorsement of the firm by the Commission and does not mean that QuadCap has attained a specific level of skill or ability.
The S&P 500 Index or Standard & Poor’s 500 Index is a market-capitalization-weighted index of 500 leading publicly traded companies in the U.S.
The Russell 2000 index measures the performance of approximately 2,000 small-cap US equities.
The MSCI EAFE Index is a stock market index that measures the performance of large- and mid-cap companies across 21 developed markets countries around the world. Canada and the USA are not included.
The MSCI Emerging Markets Index captures large and mid-cap representation across 24 Emerging Markets (EM) countries.
The Nasdaq 100 Index is a stock index of the 100 largest companies by modified market capitalization trading on Nasdaq exchanges.
The Russell 1000 Growth index is an index that tracks large cap, growth stocks. This benchmark is important for investors that might tilt their investments towards large cap growth. Growth stocks, in comparison to value stocks, are considered companies with a more growth potential, and a higher risk profile.
The Russell 1000 Value index is an index that tracks large cap, value stocks. This benchmark is important for investors that might tilt their investments towards large cap value. Value stocks, in comparison to growth stocks, are considered companies with a stable cash flow, and more mature business model.
The Dow Jones Industrial Average, or simply the Dow, is a stock market index that indicates the value of 30 large, publicly owned companies based in the United States, and how they have traded in the stock market during various periods of time. These 30 companies are also included in the S&P 500 Index. The value of the Dow is not a weighted arithmetic mean and does not represent its component companies’ market capitalization, but rather the sum of the price of one share of stock for each component company. The sum is corrected by a factor which changes whenever one of the component stocks has a stock split or stock dividend, so as to generate a consistent value for the index.
The Bloomberg US Aggregate Bond Index is used as a benchmark for investment grade bonds within the United States. This index is important as a benchmark for someone wanting to track their fixed income asset allocation.
The Bloomberg US Corporate Index covers performance for United States corporate bonds. This index serves as an important benchmark for portfolios that include exposure to investment grade corporate bonds.
The Bloomberg US Corporate High Yield Index covers performance for United States high yield corporate bonds. This index serves as an important benchmark for portfolios that include exposure to riskier corporate bonds that might not necessarily be investment grade.
Treasuries, also known as Treasury securities, are debt obligations issued by the United States government. They are used to raise cash needed to fund government operations and help finance the federal deficit. Treasuries are backed by the full faith and credit of the US government, making them one of the safest investments. They are an important instrument in monetary policy, allowing central banks to control the money supply.
The Prime Rate is the interest rate that commercial banks charge their most creditworthy corporate customers. The prime rate is derived from the federal funds rate, usually using fed funds + 3 as the formula.