

3Q 2024 Recap & 4Q 2024 Outlook
Key Updates on the Economy & Markets
The most significant development in 3Q24 was the Federal Reserve’s decision to cut interest rates by -0.50%, the first rate cut of this cycle. It came as the Fed shifted its focus, with unemployment rising to a 33-month high and inflation moving back to target. In the equity market, stocks ended the quarter higher despite turbulence, including the brief but sharp sell-off in early August. The S&P 500 posted its fourth consecutive quarterly gain and ended September near an all-time high.
The Federal Reserve Cuts Interest Rates by -0.50%
In 3Q24, the Fed started the process of normalizing interest rates after a volatile five years. The Fed cut interest rates to near-zero during the COVID-19 pandemic to support the economy. It kept rates near 0% until March 2022, when it began raising interest rates in response to soaring inflation. From March 2022 to July 2023, the central bank raised rates by +5%, one of the largest and fastest rate-hiking cycles in recent decades. The Fed held interest rates steady for over a year as it waited for inflation to return to its 2% target. After 14 months, it started the rate-cutting cycle with a -0.50% cut at its September meeting.
The Fed’s transition to cutting interest rates comes as its focus shifts from lowering inflation to supporting the labor market. Since the last rate hike in July 2023, inflation has dropped from 3.3% to 2.6%. However, unemployment has risen from 3.5% to 4.2% over the same period, the highest level since October 2021. The Fed is more confident that inflation will return to its 2% target, but it’s concerned about the health of the U.S. labor market. The critical question for the Fed and investors is what the labor market softening over the past year represents. Is the labor market simply normalizing after experiencing significant disruption during the pandemic, or is it an early sign of weakening labor demand?
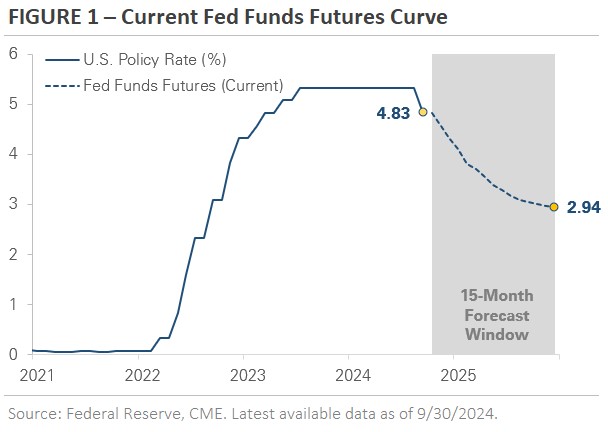
Investors expect the Fed to cut interest rates at its two remaining meetings this year, with further reductions expected throughout 2025. Figure 1 uses Fed funds futures to show the market’s rate-cut expectations. The market expects an additional -0.50% rate cut by the end of this year, followed by another -1.50% by the end of 2025. Investors are betting that falling inflation and rising unemployment will cause the Fed to implement significant rate cuts. History indicates that the timing and amount of rate cuts will depend on the economy’s path. A weaker economy would justify more rate cuts, while a more robust economy could require fewer.
Analyzing the Impact of the Fed’s Interest Rate Hikes on the U.S. Economy
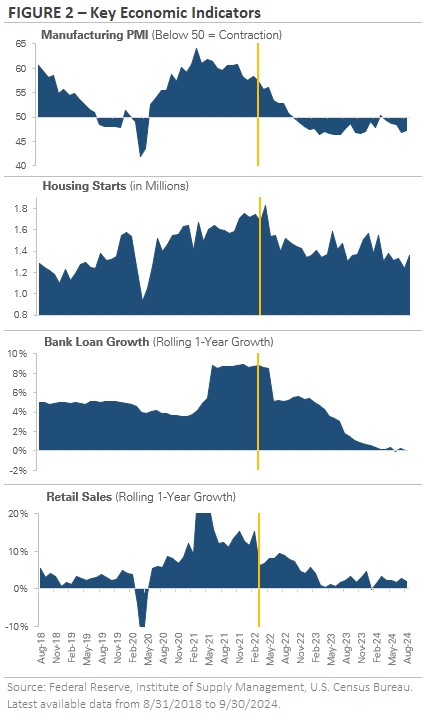
Figure 2 graphs four economic indicators that offer insight into the current state of the U.S. economy:
1) manufacturing PMI
2) housing starts
3) consumer credit
4) retail sales.
Each chart marks the start of the Fed’s tightening cycle in March 2022 to show the impact of interest rate hikes.
The first chart shows the Manufacturing PMI (Purchasing Managers’ Index), a key gauge of manufacturing activity. Values above 50 indicate expansion, while those below 50 signal contraction. The pandemic triggered a sharp decline in manufacturing, followed by a strong recovery in 2021. However, since the Fed began raising interest rates, the PMI has steadily declined and remained below 50. This suggests the manufacturing sector is contracting. The caveat is manufacturing contributes only 10-12% of the US economy, thus less material than the services sector’s contribution.
The second chart tracks the number of new residential construction projects, an important leading indicator and a key measure of housing market health. After dropping early in the pandemic, housing starts rebounded through early 2022. However, as the Fed raised interest rates, the number of housing starts declined. This downward trend reflects the impact of higher mortgage rates, which have reduced affordability and dampened construction activity.
The third chart tracks the year-over-year change in consumer credit outstanding. This metric provides insight into the willingness of consumers to take on new debt, such as car and auto loans. Loan growth surged during the pandemic, fueled by fiscal stimulus, low interest rates, and rising wages. However, since the Fed began raising rates, loan growth has flatlined. Slowing loan growth can be a sign that consumers are less willing or able to borrow due to higher interest rates, which can curb purchases of interest-rate-sensitive goods like homes, autos, and boats.
The fourth chart graphs retail sales. Consumer spending is a key driver of economic growth since it makes up a large portion of GDP. Retail sales plummeted as the economy shut down in the pandemic, but spending rebounded sharply in late 2020 and 2021. While retail sales growth has slowed with rising interest rates, it remains positive, indicating that consumer spending is holding up relatively well despite higher rates. The consumer’s willingness to keep spending has been a source of strength and economic resilience.
Together, these data points reveal the impact of rate hikes on the economy. Higher interest rates appear to be weighing on manufacturing, housing, and loan growth. However, the main engine of the economy, the consumer, continues to spend. The data suggest that the current level of interest rates is restrictive, and the Fed’s goal in lowering rates is to stimulate interest-rate-sensitive sectors and prevent a deeper slowdown. Economists will monitor these data points in the coming months and quarters to gauge the impact of the Fed’s interest rate cuts on the economy.
Financial Markets Experience Increased Volatility
In early August, the stock and bond markets experienced significant volatility. Signs of investor angst started to appear during earnings season in July, when investors raised concerns about the high costs of developing artificial intelligence (AI) and whether future revenues would justify the expensive investments. A few weeks later, investors were spooked as unemployment rose from 4.1% to 4.3%. Investors worried the Fed had waited too long to cut rates and risked tipping the U.S. economy into a recession that could be hard to reverse.
The sudden surge in market volatility led to a significant deleveraging event across global financial markets. The S&P 500 traded down nearly -8% from mid-July through the first week of August. However, the volatility was short-lived, and the S&P 500 rebounded to end August with a modest gain. Some residual volatility was in early September as investors returned from summer break. Still, the S&P 500 again recovered quickly and set a new all-time high later in the month. The rise in market volatility marks a significant shift from the past 12 months of steady S&P 500 gains. So far, investors have brushed it aside.
Equity Market Recap – Stocks Trade Higher as Investors Rotate Within the Market
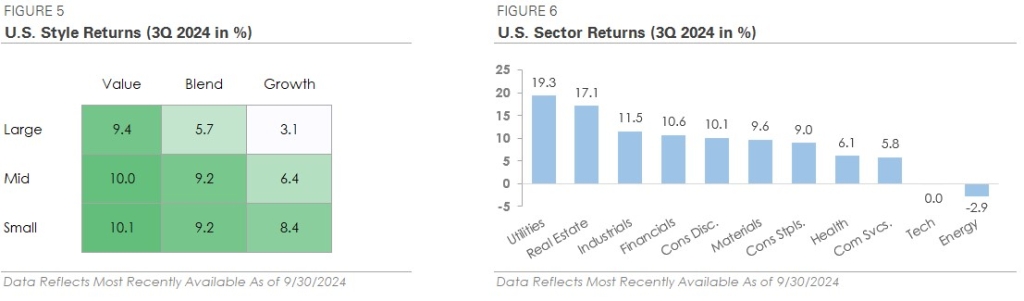
Despite the volatility, the S&P 500 set multiple new all-time highs in 3Q24, adding to its list of new highs from earlier in the year. However, it was the change in stock market leadership that made headlines. The Equal-Weighted S&P 500, the Russell 2000, and the Value factor all outperformed the S&P 500, while the Growth factor underperformed. A similar pattern occurred at the sector level, with underperformers from the first half of 2024 outperforming in 3Q24. Interest-rate-sensitive sectors outperformed in anticipation of rate cuts, with the Utility and Real Estate sectors both gaining over +17%. Cyclical sectors, including Industrials, Financials, Consumer Discretionary, and Materials, also outperformed the S&P 500. In contrast, the Technology sector lagged the market rally, ending the quarter flat after outperforming in the first half of the year.
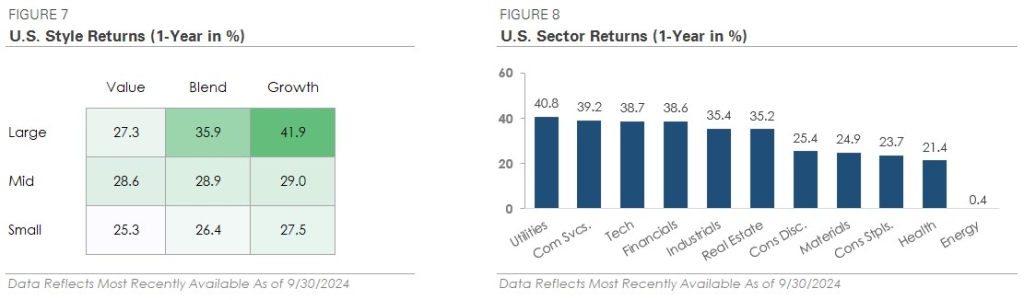
Two key events, the Fed’s first interest rate cut in September and growing concerns about AI’s near-term profitability, led to the change in market leadership in 3Q24. In the first half of 2024, uncertainty around Fed policy and concerns about the economy pushed investors toward large-caps and AI stocks. Meanwhile, smaller companies underperformed due to worries about their sensitivity to higher interest rates. With the Fed now officially cutting interest rates and doubts emerging about AI’s monetization potential, investors sought out new investment opportunities in 3Q24.
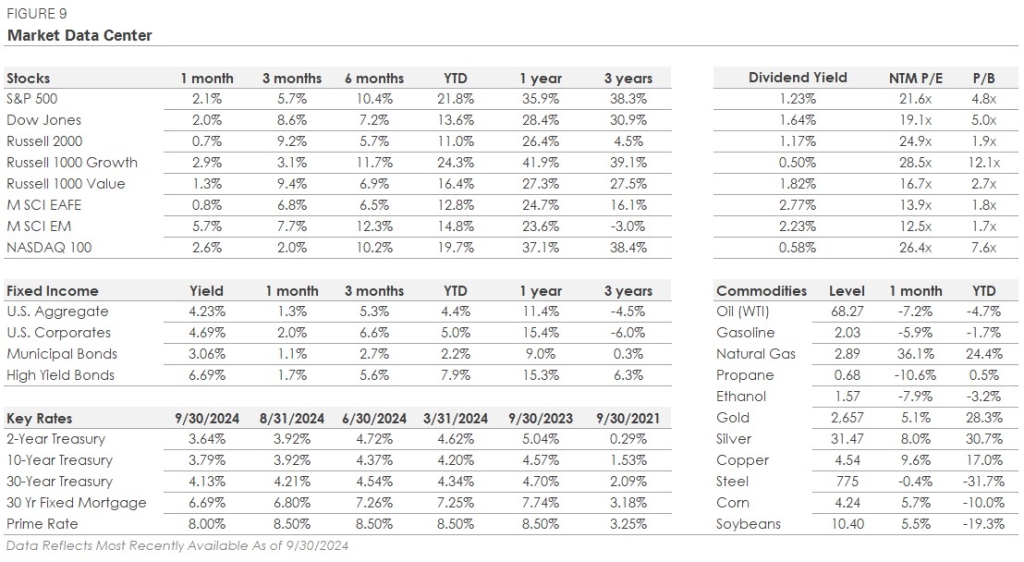
International stocks outperformed U.S. stocks in 3Q24 for the first time since 4Q22. The MSCI Emerging Market Index gained +7.7%, outperforming the S&P 500 by almost +2%. The MSCI EAFE Index of developed market stocks also outperformed the S&P 500, returning +6.8%. International stocks benefited from two themes: a weaker U.S. dollar and AI companies’ underperformance during the stock market rotation. However, despite outperforming in 3Q24, the two major international indices are still underperforming year-to-date due to their lack of exposure to AI stocks.
Credit Market Recap – Bonds Trade Higher in Anticipation of Interest Rate Cuts
In 3Q24, bonds traded higher as investors prepared for the start of the Fed’s rate-cutting cycle. The 10-year Treasury yield fell from 4.37% at the end of June to 3.79% at the end of September. The 2-year yield, which is a proxy for investors’ rate cut expectations, fell from 4.72% to 3.64% over the same period. Falling Treasury yields provided a boost to bonds overall, but there was an interesting dynamic within the credit market. The top two performing corporate bond groups were on opposite ends of the rating spectrum, but their returns were both linked to the start of rate cuts.
On one end, CCC-rated bonds, the lowest-rated and most sensitive to economic conditions, produced a total return of over +11% as corporate credit spreads tightened. The group’s outperformance suggests that investors expect interest rate cuts to stimulate economic growth and make refinancing easier. On the other end, AAA-rated bonds, the highest quality and most sensitive to interest rate changes, gained over +6%. Together, the two groups’ outperformance indicates that investors expect rate cuts to boost economic growth and relieve pressure on highly leveraged companies.
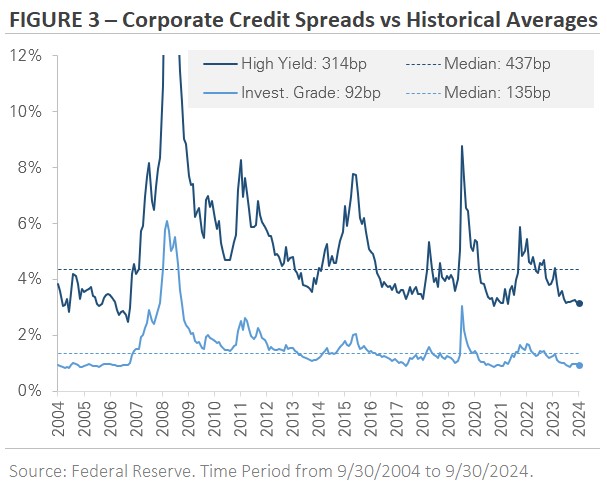
Credit spreads, which measure the difference in yield between two bonds of similar maturity but different credit quality, remain tight by historical standards. Figure 3 graphs the credit spreads for corporate investment grade (IG) and high yield (HY) bonds over the past 20 years. The IG spread stands at 0.92%, meaning that investors are earning an extra +0.92% of yield by owning IG over similar Treasury bonds. Since 2004, the median IG spread has been 1.35%. The situation is similar for HY bonds, where the current spread is 3.14% compared to a median of 4.37%.
The takeaway is that corporate bond investors receive less yield compensation for taking on corporate credit risk compared to the past 20 years. Credit spreads are often used to gauge financial conditions and investor sentiment toward the economy. Today’s tight spreads signal economic stability, strong market liquidity, investor willingness to buy risky assets, and low perceived default risk.
Fourth Quarter Outlook – Themes to Watch
The two key questions are how much the Fed will cut interest rates and how the economy will respond to those rate cuts. The next six months will be critical in providing answers to these questions, and investors will analyze each economic data point for clues about the economy’s trajectory. This intense focus on economic data may have the unintended consequence of keeping market volatility elevated as investors flip between optimism and pessimism.
The next chart demonstrates why the economy’s direction is important. Figure 4 tracks the S&P 500’s performance in the 12 months before and after the first interest rate cut. It features two paths. The dark blue line represents the S&P 500’s median return path when the economy avoids a recession in the 12 months following the first rate cut. The light blue line represents the S&P 500’s median return path when the economy enters a recession within 12 months after the first rate cut. For comparison, the two lines are indexed to 100 the week of the Fed’s first interest rate cut.
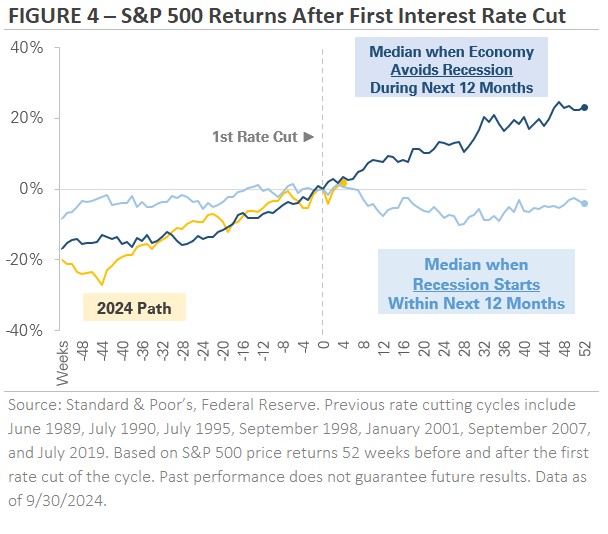
Historically, the S&P 500 has performed very differently depending on whether or not the economy falls into a recession after the first rate cut. When rate cuts stimulate economic growth, the S&P 500 gains an average of +23% over the next 12 months. However, if a recession follows, the S&P 500 produces an average return of -4%. Our team will monitor economic data in the coming months to see what impact interest rate cuts have on the economy.
To close, we want to briefly touch on the upcoming November election. Political views can stir strong emotions but making investment choices based on those feelings can lead to poor portfolio decisions. Data suggests that whichever party occupies the White House has little to no impact on investment performance, with fundamental factors like corporate earnings growth and valuations impacting the stock market far more than political headlines. The U.S. economy’s success, growth, and resiliency don’t change with each new election, and neither should your long-term investment strategy.
This Quarter in Numbers
Important Disclosures
Published by Market Desk Research and distributed by QuadCap Wealth Management, LLC.
This client letter is being furnished by QuadCap Wealth Management, LLC (“QuadCap”) on a confidential basis for the exclusive use of clients of QuadCap. and may not be disseminated, communicated, reproduced, redistributed or otherwise disclosed by the recipient to any other person without the prior written consent of QuadCap.
This document does not constitute an offer, solicitation or recommendation to sell or an offer to buy any securities, investment products or investment advisory services. Such an offer may only be made to prospective investors by means of delivery of an investment advisory agreement, subscription agreement and other similar materials that contain a description of the material terms relating to such investment, investment strategy or service. This presentation is being provided for general informational purposes only.
This presentation includes information based on data found in independent industry publications and other sources and is current as of the date of this presentation. Although we believe that the data are reliable, we have not sought, nor have we received, permission from any third-party to include their information in this presentation. Charts, tables and graphs contained in this document are not intended to be used to assist the reader in determining which securities to buy or sell or when to buy or sell securities. Opinions, estimates, and projections constitute the current judgment of QuadCap and are subject to change without notice.
References to any indices are for informational and general comparative purposes only. There are significant differences between such indices and the investment programs described in this presentation. References to indices do not suggest that the investment programs will, or are likely to, achieve returns, volatility, or other results similar to such indices. The performance data of various indices presented herein was current as of the date of the presentation.
Past performance is not indicative of future results and there can be no assurance that the future performance of any specific investment or investment strategy will be profitable or equal any corresponding index or benchmark.
Advisory Services are offered through QuadCap, an SEC registered investment advisor. QuadCap only transacts business in states where it is properly registered or is excluded or exempted from registration requirements. SEC registration is not an endorsement of the firm by the Commission and does not mean that QuadCap has attained a specific level of skill or ability.
The S&P 500 Index or Standard & Poor’s 500 Index is a market-capitalization-weighted index of 500 leading publicly traded companies in the U.S.
The Russell 2000 index measures the performance of approximately 2,000 small-cap US equities.
The MSCI EAFE Index is a stock market index that measures the performance of large- and mid-cap companies across 21 developed markets countries around the world. Canada and the USA are not included.
The MSCI Emerging Markets Index captures large and mid cap representation across 24 Emerging Markets (EM) countries.
The Nasdaq 100 Index is a stock index of the 100 largest companies by modified market capitalization trading on Nasdaq exchanges.
The Russell 1000 Growth index is an index that tracks large cap, growth stocks. This benchmark is important for investors that might tilt their investments towards large cap growth. Growth stocks, in comparison to value stocks, are considered companies with a more growth potential, and a higher risk profile.
The Russell 1000 Value index is an index that tracks large cap, value stocks. This benchmark is important for investors that might tilt their investments towards large cap value. Value stocks, in comparison to growth stocks, are considered companies with a stable cash flow, and more mature business model.
The CBOE VIX Index is a calculation designed to produce a measure of constant, 30-day expected volatility of the U.S. stock market, derived from real-time, mid-quote prices of S&P 500® Index (SPX℠) call and put options.
The Magnificent 7 is a group of major tech companies with stock growth that, on average, far outpaced the high-performing S&P 500® in recent years.
Coined in 2023, the group consists of Alphabet, Amazon, Apple, Meta Platforms, Microsoft, Nvidia, and Tesla.
The Dow Jones Industrial Average, or simply the Dow, is a stock market index that indicates the value of 30 large, publicly owned companies based in the United States, and how they have traded in the stock market during various periods of time. These 30 companies are also included in the S&P 500 Index. The value of the Dow is not a weighted arithmetic mean and does not represent its component companies’ market capitalization, but rather the sum of the price of one share of stock for each component company. The sum is corrected by a factor which changes whenever one of the component stocks has a stock split or stock dividend, so as to generate a consistent value for the index.
The Bloomberg US Aggregate Bond Index is used as a benchmark for investment grade bonds within the United States. This index is important as a benchmark for someone wanting to track their fixed income asset allocation.
The Bloomberg US Corporate Index covers performance for United States corporate bonds. This index serves as an important benchmark for portfolios that include exposure to investment grade corporate bonds.
The Bloomberg US Corporate High Yield Index covers performance for United States high yield corporate bonds. This index serves as an important benchmark for portfolios that include exposure to riskier corporate bonds that might not necessarily be investment grade.
Treasuries, also known as Treasury securities, are debt obligations issued by the United States government. They are used to raise cash needed to fund government operations and help finance the federal deficit. Treasuries are backed by the full faith and credit of the US government, making them one of the safest investments. They are an important instrument in monetary policy, allowing central banks to control the money supply.
The Prime Rate is the interest rate that commercial banks charge their most creditworthy corporate customers. The prime rate is derived from the federal funds rate, usually using fed funds + 3 as the formula.