3 Financial Planning Questions with Higher Gas Prices
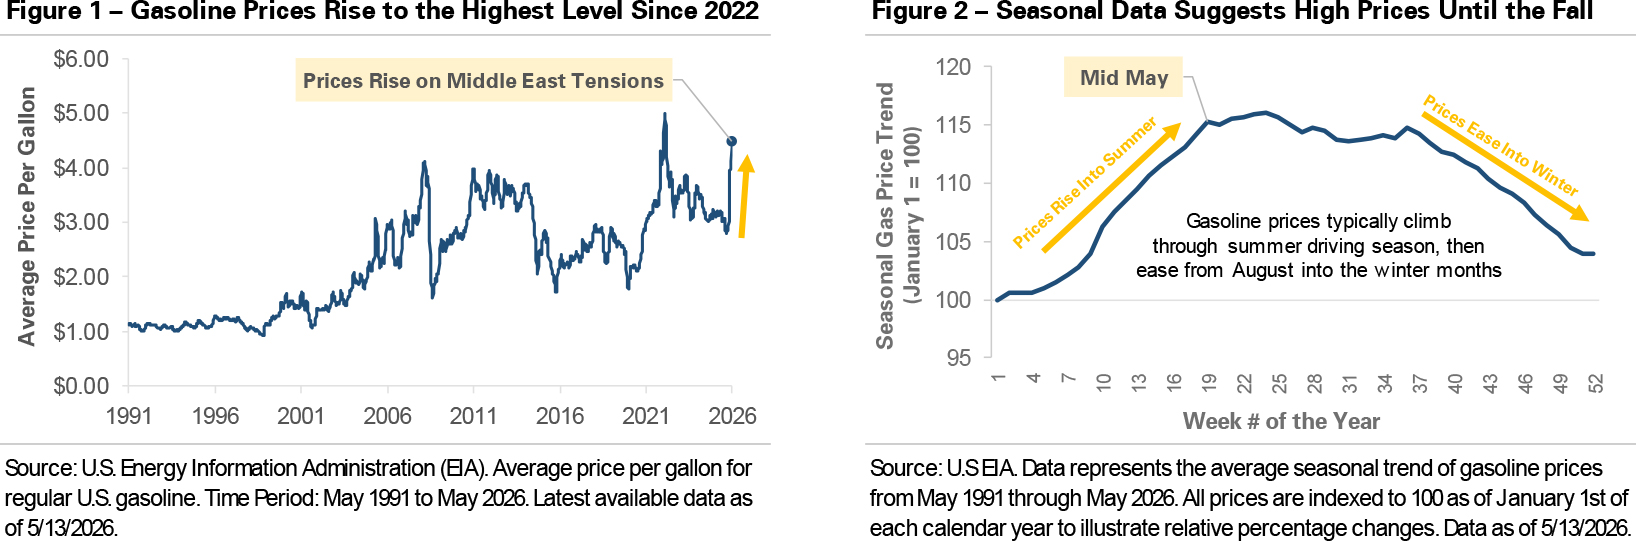
The national average price of a gallon of gasoline has climbed above $4.50, up nearly 50% since the start of the U.S.-Iran conflict in late February. The cause is a global oil supply disruption. Approximately 20% of the world’s oil moves through the Strait of Hormuz, a shipping route in the Middle East, and traffic remains significantly below pre-conflict levels. Crude prices have risen as oil supply shrinks, and the price at the pump has followed. The pressure extends beyond the gas pump, with diesel costs feeding into the price of goods moved by truck. The cost increase is starting to work its way into household budgets as inflation pressures build.
Headlines like these tend to generate predictions about where prices go next. Predictions are interesting but rarely actionable. The more useful response is to turn the moment into a short list of questions worth answering. Three are worth discussing now.
1. Where is the gas price increase being absorbed in your monthly budget?
A household with two cars is paying roughly $1,200 to $1,800 more per year on fuel than it was earlier this year. The increase is absorbed somewhere, and in most households, it lands in one of two places: the amount being saved each month, or the amount being withdrawn from the investment portfolio. Neither is an incorrect answer, but both are worth being intentional about rather than letting them adjust by default. The practical question is whether the current absorption is the right one or whether a modest adjustment, such as deferring a purchase or temporarily reducing savings, makes more sense. In most cases, the financial plan accommodates the change without revision. The value is in making the choice deliberately.
2. Does the current retirement income plan still comfortably cover spending?
For retired households, the question is narrower: is this year’s spending tracking the plan, or running ahead of it? A temporary period of elevated fuel and grocery costs usually falls inside the margin a retirement plan is built with, but that’s worth confirming rather than assuming. The check is straightforward: compare actual spending over the past several months against what the plan assumed for the year and look at whether the gap is closing on its own as prices stabilize or widening as higher costs work into more categories. Surfacing the answer early is what makes any response, if one is needed, a small one rather than a large one.
3. Does a stretch of higher inflation change the long-term plan?
Usually not. The inflation assumption inside a financial plan is a long-run average rather than a forecast of any single year. A stretch of 4% inflation, even one that lasts several quarters, doesn’t meaningfully change a long-run average measured over decades. The plan is designed to absorb this kind of variation without needing to be rewritten. For clients approaching retirement, the relevant check is whether the savings target they are working toward still matches the life they are planning for. For clients earlier in the saving years, it is a reminder that the cost of the future is not a fixed number, which is why the plan is reviewed and updated over time rather than set once.
The Bottom Line
These questions are part of the regular planning review cycle, and an environment like this one is a normal input into the work as it happens. The price at the pump is a useful reminder that the cost of living isn’t a fixed number, but it’s a small input into a plan built around a much longer time horizon. The plan operates on a longer time horizon than any single price moves, which is the reason it can absorb a moment like this one without needing to react to it.
Important Disclosures
Published by Market Desk Research and distributed by QuadCap Wealth Management, LLC.
This client letter is being furnished by QuadCap Wealth Management, LLC (“QuadCap”) on a confidential basis for the exclusive use of clients of QuadCap. and may not be disseminated, communicated, reproduced, redistributed or otherwise disclosed by the recipient to any other person without the prior written consent of QuadCap.
This document does not constitute an offer, solicitation or recommendation to sell or an offer to buy any securities, investment products or investment advisory services. Such an offer may only be made to prospective investors by means of delivery of an investment advisory agreement, subscription agreement and other similar materials that contain a description of the material terms relating to such investment, investment strategy or service. This presentation is being provided for general informational purposes only.
This presentation includes information based on data found in independent industry publications and other sources and is current as of the date of this presentation. Although we believe that the data is reliable, we have not sought, nor have we received, permission from any third-party to include their information in this presentation. Charts, tables and graphs contained in this document are not intended to be used to assist the reader in determining which securities to buy or sell or when to buy or sell securities. Opinions, estimates, and projections constitute the current judgment of QuadCap and are subject to change without notice.
References to any indices are for informational and general comparative purposes only. There are significant differences between such indices and the investment programs described in this presentation. References to indices do not suggest that the investment programs will, or are likely to, achieve returns, volatility, or other results similar to such indices. The performance data of various indices presented herein was current as of the date of the presentation.
Investing involves risk, including the potential loss of principal. Past performance is not indicative of future results and there can be no assurance that the future performance of any specific investment or investment strategy will be profitable or equal to any corresponding index or benchmark. The information provided is for informational purposes only and does not constitute investment advice, an offer to sell, or a solicitation to buy any security. Investors should carefully consider their investment objectives, risk tolerance, time horizon, and liquidity needs before investing. Please consult a qualified financial advisor before making any investment decisions. The performance information shown herein is based on total returns with dividends reinvested and does not reflect the deduction of advisory and/or other fees normally incurred in the management of a portfolio.
Advisory Services are offered through QuadCap, an SEC registered investment advisor. QuadCap only transacts business in states where it is properly registered or is excluded or exempted from registration requirements. SEC registration is not an endorsement of the firm by the Commission and does not mean that QuadCap has attained a specific level of skill or ability.
The S&P 500 Index or Standard & Poor’s 500 Index is a market-capitalization-weighted index of 500 leading publicly traded companies in the U.S.
The Russell 2000 index measures the performance of approximately 2,000 small-cap US equities.
The MSCI EAFE Index is a stock market index that measures the performance of large- and mid-cap companies across 21 developed markets countries around the world. Canada and the USA are not included.
The MSCI Emerging Markets Index captures large and mid cap representation across 24 Emerging Markets (EM) countries.
The Nasdaq 100 Index is a stock index of the 100 largest companies by modified market capitalization trading on Nasdaq exchanges.
The Russell 1000 Growth index is an index that tracks large cap, growth stocks. This benchmark is important for investors that might tilt their investments towards large cap growth. Growth stocks, in comparison to value stocks, are considered companies with a more growth potential, and a higher risk profile.
The Russell 1000 Value index is an index that tracks large cap, value stocks. This benchmark is important for investors that might tilt their investments towards large cap value. Value stocks, in comparison to growth stocks, are considered companies with a stable cash flow, and more mature business model.
The Dow Jones Industrial Average, or simply the Dow, is a stock market index that indicates the value of 30 large, publicly owned companies based in the United States, and how they have traded in the stock market during various periods of time. These 30 companies are also included in the S&P 500 Index. The value of the Dow is not a weighted arithmetic mean and does not represent its component companies’ market capitalization, but rather the sum of the price of one share of stock for each component company. The sum is corrected by a factor which changes whenever one of the component stocks has a stock split or stock dividend, so as to generate a consistent value for the index.
The Bloomberg US Aggregate Bond Index is used as a benchmark for investment grade bonds within the United States. This index is important as a benchmark for someone wanting to track their fixed income asset allocation.
The Bloomberg US Corporate Index covers performance for United States corporate bonds. This index serves as an important benchmark for portfolios that include exposure to investment grade corporate bonds.
The Bloomberg US Corporate High Yield Index covers performance for United States high yield corporate bonds. This index serves as an important benchmark for portfolios that include exposure to riskier corporate bonds that might not necessarily be investment grade.
Treasuries, also known as Treasury securities, are debt obligations issued by the United States government. They are used to raise cash needed to fund government operations and help finance the federal deficit. Treasuries are backed by the full faith and credit of the US government, making them one of the safest investments. They are an important instrument in monetary policy, allowing central banks to control the money supply.
The Prime Rate is the interest rate that commercial banks charge their most creditworthy corporate customers. The prime rate is derived from the federal funds rate, usually using fed funds + 3 as the formula.