AI and Geopolitics Continue to Drive Markets
Monthly Market Summary
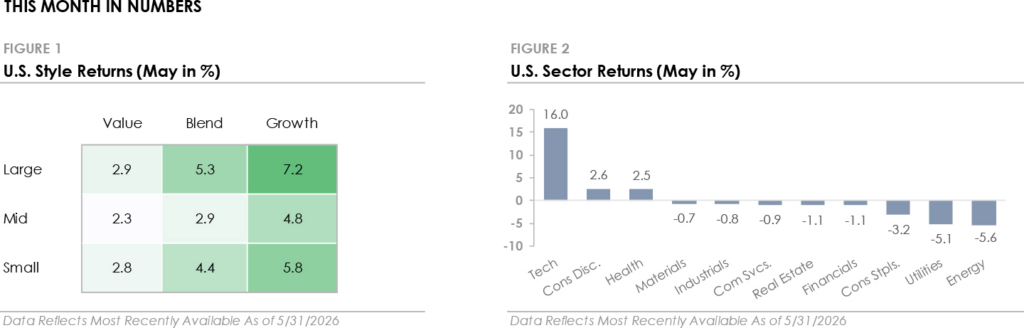
- The S&P 500 Index gained +5.3% in May and set multiple new all-time highs. Technology led all S&P 500 sectors with a +16.0% return, followed by Consumer Discretionary (+2.6%) and Health Care (+2.5%). However, eight of eleven sectors traded lower, led by Energy (-5.6%), Utilities (-5.1%), and Consumer Staples (-3.2%).
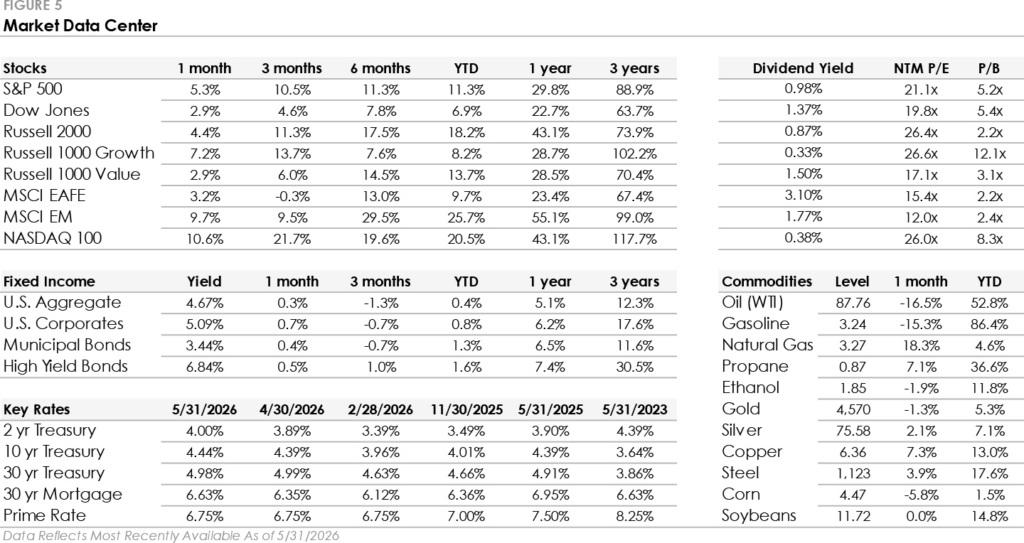
- Bonds traded higher despite a mid-month surge in Treasury yields. The U.S. Bond Aggregate returned +0.3% but underperformed corporate bonds as credit spreads tightened. Investment-grade and high-yield corporates returned +0.7% and +0.5%, respectively, with both outperforming the broader Bond Aggregate.
- International stock traded higher in May but were mixed. Emerging markets gained +9.7% and outperformed the S&P 500, while developed markets’ +3.2% return lagged both U.S stocks and emerging markets.
Stocks Set New Highs as Geopolitical Tensions Ease
May was a strong month for equities, with most major indexes setting fresh all-time highs. The S&P 500 and tech-heavy Nasdaq 100 set new highs each week, with the Dow Jones and Russell 2000 also setting new highs throughout the month. Even the equal-weight S&P 500, which gives each company the same weight regardless of market cap, set a new high. While the equal-weighted index’s move signals broadening participation, leadership was narrow within the index. The technology sector gained +16% and was the only sector to outperform the S&P 500 Index. Eight of eleven S&P 500 sectors traded lower, and ten of eleven sectors underperformed the index. The concentration showed up in factor indexes as well, with large-cap growth returning +7.2% versus +2.9% for large-cap value. The performance gap highlights a notable trend this year: AI and tech stocks continue to outperform more traditional, cyclical companies.
Bonds also traded higher, with the U.S. Aggregate Bond Index returning +0.3% and corporate bonds outperforming as credit spreads tightened further. The bond market’s gains came despite a surge in interest rates mid-month. The 30-year Treasury yield spiked above 5%, reaching levels last seen in 2007, and the 10-year Treasury set a new 52-week high. The trigger was back-to-back hot inflation reports for consumer and producer prices, with the Middle East conflict and elevated oil prices creating broader price pressures. Following the inflation reports, the market now places a greater than 50% probability of a Fed rate hike at the December 2026 meeting, a significant shift from earlier in the year when the market assumed a rate-cutting path. With Treasury yields at multi-decade highs and oil prices leading to inflation concerns, the bond market is shifting toward interest rates remaining higher for longer.
This Year’s Two Defining Themes: Geopolitics & Artificial Intelligence
Two themes have defined markets this year. The first is geopolitics. Trade and tariff uncertainty earlier in the year has given way to military conflict in the Middle East, which has created an oil supply disruption. The Strait of Hormuz, which carries roughly 20% of global oil supply, has been effectively closed since the conflict began in late February, causing global oil inventories to shrink. Oil prices remain elevated after briefly hitting four-year highs earlier this year but have been relatively contained given the extent of the oil supply disruption. There was partial relief in May as U.S.-Iran negotiations progressed and the market began pricing in a potential reopening of the Strait. West Texas Intermediate crude ended the month below $90 per barrel, down -16.5%. However, the path forward remains uncertain, as a successful deal would take months to restore shipping traffic to pre-conflict levels. What happens next in the Middle East will impact energy prices, the inflation outlook, and the broader financial market.
The second theme is the artificial intelligence buildout. Companies have committed hundreds of billions to build the AI industry’s physical backbone, including data centers, computer chips, and power generation. Forecasted 2026 capital spending across the leading tech companies now exceeds $600 billion, with most of the capex directed at AI infrastructure. The spending is driving economic growth and starting to show up in corporate earnings, with AI-linked revenue growth becoming a significant driver of overall S&P 500 profit growth. The investment is also creating drastic changes. Shortages across parts of the technology supply chains are creating bottlenecks, and companies are experiencing rapid growth as they repurpose products and services for the age of AI. The pace of spending and technological change explains much of the performance gap between the tech sector and more traditional areas of the stock market.
This Month in Numbers
Important Disclosures
Published by Market Desk Research and distributed by QuadCap Wealth Management, LLC.
This client letter is being furnished by QuadCap Wealth Management, LLC (“QuadCap”) on a confidential basis for the exclusive use of clients of QuadCap. and may not be disseminated, communicated, reproduced, redistributed or otherwise disclosed by the recipient to any other person without the prior written consent of QuadCap.
This document does not constitute an offer, solicitation or recommendation to sell or an offer to buy any securities, investment products or investment advisory services. Such an offer may only be made to prospective investors by means of delivery of an investment advisory agreement, subscription agreement and other similar materials that contain a description of the material terms relating to such investment, investment strategy or service. This presentation is being provided for general informational purposes only.
This presentation includes information based on data found in independent industry publications and other sources and is current as of the date of this presentation. Although we believe that the data are reliable, we have not sought, nor have we received, permission from any third-party to include their information in this presentation. Charts, tables and graphs contained in this document are not intended to be used to assist the reader in determining which securities to buy or sell or when to buy or sell securities. Opinions, estimates, and projections constitute the current judgment of QuadCap and are subject to change without notice.
References to any indices are for informational and general comparative purposes only. There are significant differences between such indices and the investment programs described in this presentation. References to indices do not suggest that the investment programs will, or are likely to, achieve returns, volatility, or other results similar to such indices. The performance data of various indices presented herein was current as of the date of the presentation.
All investment involves risk. Past performance is not indicative of future results and there can be no assurance that the future performance of any specific investment or investment strategy will be profitable or equal any corresponding index or benchmark. Diversification does not guarantee a profit or protect against loss. The performance information shown herein is based on total returns with dividends reinvested and does not reflect the deduction of advisory and/or other fees normally incurred in the management of a portfolio. Stock performance and fundamental data is based on the following instruments: SPDR S&P 500 ETF (SPY), SPDR Dow Jones ETF (DIA), iShares Russell 2000 ETF (IWM), iShares Russell 1000 Growth ETF (IWF), iShares Russell 1000 Value ETF (IWD), iShares MSCI EAFE ETF (EFA), iShares MSCI Emerging Markets ETF (EEM), Invesco QQQ Trust (QQQ). Fixed Income performance is based on the following instruments: iShares Core U.S. Aggregate Bond ETF (AGG), iShares Investment Grade Corporate ETF (LQD), iShares National Muni Bond ETF (MUB), iShares High Yield Corporate ETF (HYG). Fixed Income yields and key rates are based on the following instruments: Bloomberg US Aggregate, ICE BofA US Corporate, ICE BofA US Municipal Securities, ICE BofA US High Yield, 2 Year US Benchmark Bond, 10 Year US Benchmark Bond, 30 Year US Benchmark Bond, 30 Year US Fixed Mortgage Rate, US Prime Rate. Commodity prices are based on the following instruments: Crude Oil WTI (NYM $/bbl), Gasoline Regular U.S. Gulf Coast ($/gal), Natural Gas (NYM $/mmbtu), Propane (NYM $/gal), Ethanol (CRB $/gallon), Gold (NYM $/ozt), Silver (NYM $/ozt), Copper NYMEX ($/lb), U.S. Midwest Domestic Hot-Rolled Coil Steel (NYM $/st), Corn (CBT $/bu), Soybeans (Chicago $/bu). U.S. Style performance is based on the following instruments: iShares Russell 1000 Value ETF (IWD), SPDR S&P 500 ETF Trust (SPY), iShares Russell 1000 Growth ETF (IWF), iShares Russell Mid-Cap Value ETF (IWS), iShares Russell Midcap ETF (IWR), iShares Russell Mid-Cap Growth ETF (IWP), iShares Russell 2000 Value ETF (IWN), iShares Russell 2000 ETF (IWM), iShares Russell 2000 Growth ETF (IWO). U.S. Sector performance is based on the following instruments: Consumer Discretionary Sector SPDR ETF (XLY), Consumer Staples Sector SPDR ETF (XLP), Energy Sector SPDR ETF (XLE), Financial Sector SPDR ETF (XLF), Health Care Sector SPDR ETF (XLV), Industrial Sector SPDR ETF (XLI), Materials Sector SPDR ETF (XLB), Technology Sector SPDR ETF (XLK), Communication Services Sector SPDR ETF (XLC), Utilities Sector SPDR ETF (XLU), Real Estate Sector SPDR ETF (XLRE).
Advisory Services are offered through QuadCap, an SEC registered investment advisor. QuadCap only transacts business in states where it is properly registered or is excluded or exempted from registration requirements. SEC registration is not an endorsement of the firm by the Commission and does not mean that QuadCap has attained a specific level of skill or ability.
The S&P 500 Index or Standard & Poor’s 500 Index is a market-capitalization-weighted index of 500 leading publicly traded companies in the U.S.
The Russell 2000 index measures the performance of approximately 2,000 small-cap US equities.
The MSCI EAFE Index is a stock market index that measures the performance of large- and mid-cap companies across 21 developed markets countries around the world. Canada and the USA are not included.
The MSCI Emerging Markets Index captures large and mid-cap representation across 24 Emerging Markets (EM) countries.
The Nasdaq 100 Index is a stock index of the 100 largest companies by modified market capitalization trading on Nasdaq exchanges.
The Russell 1000 Growth index is an index that tracks large cap, growth stocks. This benchmark is important for investors that might tilt their investments towards large cap growth. Growth stocks, in comparison to value stocks, are considered companies with a more growth potential, and a higher risk profile.
The Russell 1000 Value index is an index that tracks large cap, value stocks. This benchmark is important for investors that might tilt their investments towards large cap value. Value stocks, in comparison to growth stocks, are considered companies with a stable cash flow, and more mature business model.
The Dow Jones Industrial Average, or simply the Dow, is a stock market index that indicates the value of 30 large, publicly owned companies based in the United States, and how they have traded in the stock market during various periods of time. These 30 companies are also included in the S&P 500 Index. The value of the Dow is not a weighted arithmetic mean and does not represent its component companies’ market capitalization, but rather the sum of the price of one share of stock for each component company. The sum is corrected by a factor which changes whenever one of the component stocks has a stock split or stock dividend, so as to generate a consistent value for the index.
The Bloomberg US Aggregate Bond Index is used as a benchmark for investment grade bonds within the United States. This index is important as a benchmark for someone wanting to track their fixed income asset allocation.
The Bloomberg US Corporate Index covers performance for United States corporate bonds. This index serves as an important benchmark for portfolios that include exposure to investment grade corporate bonds.
The Bloomberg US Corporate High Yield Index covers performance for United States high yield corporate bonds. This index serves as an important benchmark for portfolios that include exposure to riskier corporate bonds that might not necessarily be investment grade.
Treasuries, also known as Treasury securities, are debt obligations issued by the United States government. They are used to raise cash needed to fund government operations and help finance the federal deficit. Treasuries are backed by the full faith and credit of the US government, making them one of the safest investments. They are an important instrument in monetary policy, allowing central banks to control the money supply.
The Prime Rate is the interest rate that commercial banks charge their most creditworthy corporate customers. The prime rate is derived from the federal funds rate, usually using fed funds + 3 as the formula.