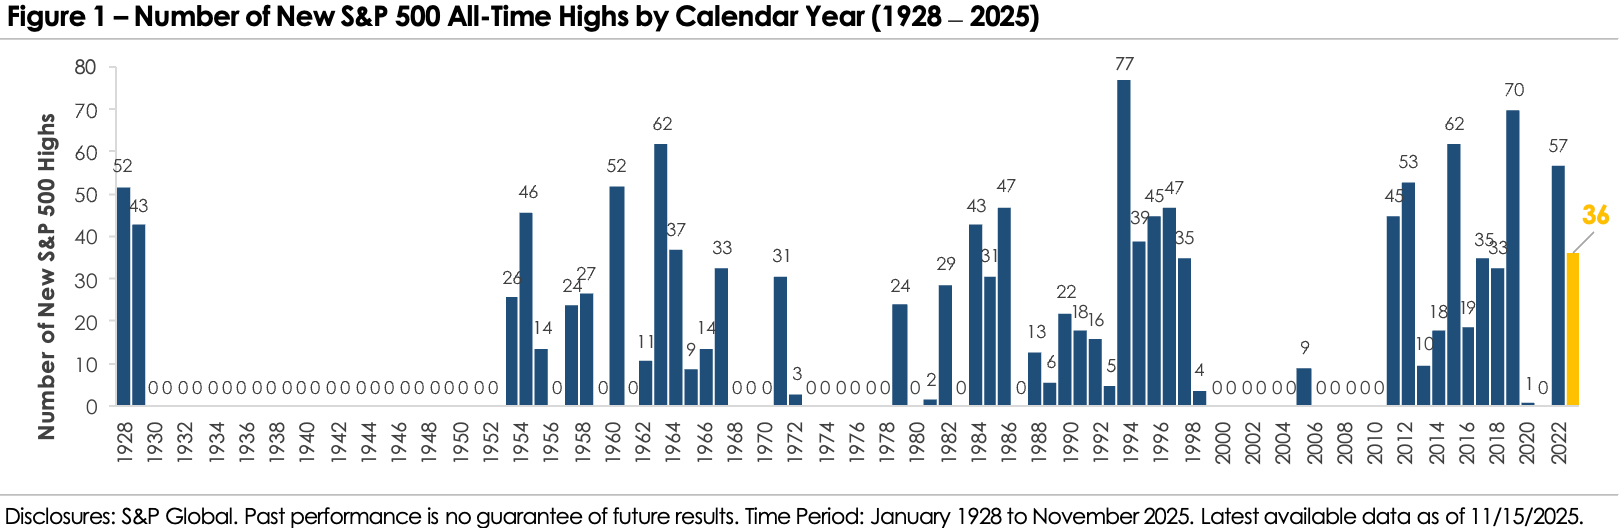
S&P 500 Sets More Than 35 New Highs for Second Consecutive Year
The stock market is having another record-setting year. The chart below shows the S&P 500 has set 36 new highs since the start of the year. While it’s a decline from last year’s pace, the number of new highs in 2025 ranks 18th compared to the past 98 years. The S&P 500’s strong performance this year is part of a broader equity market trend, with multiple other major equity indices also setting new highs. The Nasdaq has logged 36 new highs, the Dow Jones has posted 17, and the small-cap Russell 2000 has recorded six new highs after finally surpassing its 2021 peak.
A combination of themes is contributing to the stock market’s lengthy list of new highs, with the most notable being the artificial intelligence boom. Companies are spending hundreds of billions on infrastructure to train AI models, build data centers, and source the energy to run it all. Nvidia recently became the first company to surpass a $5 trillion market cap, and leading technology firms like Microsoft, Amazon, Alphabet, and Meta are reporting strong growth tied directly to demand for their cloud computing services. The industry’s momentum and forecasts for continued strong growth are driving AI stocks higher, and their large index weights are helping to push the broader markets to all-time highs despite narrow market leadership. To put the rally into perspective, the market-cap-weighted Russell 1000 Index is up +14% year-to-date. The equal-weight version of the index is up +6%, and the median stock has gained just +2%. Beneath the surface, nearly half the index is in the red, with 462 companies down year-to-date.
While AI is getting the most attention, several other catalysts have contributed to the market’s strength. After a 9-month pause, the Federal Reserve restarted its rate-cutting cycle in September, lowering interest rates by -0.50% over the past two months. Lower borrowing costs and expectations for additional rate cuts have provided a tailwind for stocks. At the same time, the U.S. economy has remained resilient in the face of multiple headwinds, including trade policy and tariffs, geopolitical tensions, and a government shutdown. Corporate earnings growth remains strong, and Q3 earnings exceeded expectations.
This year has shown the value of staying invested through uncertainty. Trade tensions and policy uncertainty have created periods of market volatility, and if investors had known the headlines before the year began, they may have been tempted to sell. However, doing so would have meant missing out on the S&P 500’s nearly +15% return and long list of new highs. Timing the market is difficult and often costly, and it can lead to missed opportunities that make it difficult to meet your financial goals. Each year brings its own reminders of core financial planning principles. If 2025 underscored the importance of staying invested, 2026 may highlight the importance of portfolio diversification.
Important Disclosures
Published by Market Desk Research and distributed by QuadCap Wealth Management, LLC.
This client letter is being furnished by QuadCap Wealth Management, LLC (“QuadCap”) on a confidential basis for the exclusive use of clients of QuadCap. and may not be disseminated, communicated, reproduced, redistributed or otherwise disclosed by the recipient to any other person without the prior written consent of QuadCap.
This document does not constitute an offer, solicitation or recommendation to sell or an offer to buy any securities, investment products or investment advisory services. Such an offer may only be made to prospective investors by means of delivery of an investment advisory agreement, subscription agreement and other similar materials that contain a description of the material terms relating to such investment, investment strategy or service. This presentation is being provided for general informational purposes only.
This presentation includes information based on data found in independent industry publications and other sources and is current as of the date of this presentation. Although we believe that the data is reliable, we have not sought, nor have we received, permission from any third-party to include their information in this presentation. Charts, tables and graphs contained in this document are not intended to be used to assist the reader in determining which securities to buy or sell or when to buy or sell securities. Opinions, estimates, and projections constitute the current judgment of QuadCap and are subject to change without notice.
References to any indices are for informational and general comparative purposes only. There are significant differences between such indices and the investment programs described in this presentation. References to indices do not suggest that the investment programs will, or are likely to, achieve returns, volatility, or other results similar to such indices. The performance data of various indices presented herein was current as of the date of the presentation.
Past performance is not indicative of future results and there can be no assurance that the future performance of any specific investment or investment strategy will be profitable or equal any corresponding index or benchmark. The performance information shown herein is based on total returns with dividends reinvested and does not reflect the deduction of advisory and/or other fees normally incurred in the management of a portfolio.
Advisory Services are offered through QuadCap, an SEC registered investment advisor. QuadCap only transacts business in states where it is properly registered or is excluded or exempted from registration requirements. SEC registration is not an endorsement of the firm by the Commission and does not mean that QuadCap has attained a specific level of skill or ability.
The S&P 500 Index or Standard & Poor’s 500 Index is a market-capitalization-weighted index of 500 leading publicly traded companies in the U.S.
The Russell 2000 index measures the performance of approximately 2,000 small-cap US equities.
The Nasdaq 100 Index is a stock index of the 100 largest companies by modified market capitalization trading on Nasdaq exchanges.
The Dow Jones Industrial Average, or simply the Dow, is a stock market index that indicates the value of 30 large, publicly owned companies based in the United States, and how they have traded in the stock market during various periods of time. These 30 companies are also included in the S&P 500 Index. The value of the Dow is not a weighted arithmetic mean and does not represent its component companies’ market capitalization, but rather the sum of the price of one share of stock for each component company. The sum is corrected by a factor which changes whenever one of the component stocks has a stock split or stock dividend, so as to generate a consistent value for the index.
The Russell 1000 Index is a U.S. stock market index that tracks the largest 1,000 stocks in the Russell 3000 Index, which represent about 93% of the total market capitalization of that index.