

Making Sense of the Tariff Announcement
Trump Administration Introduces New Tariff Measures
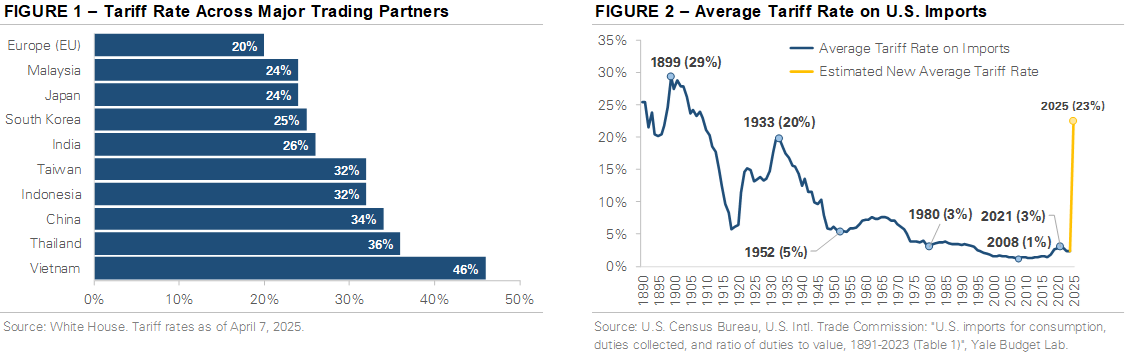
On April 2nd, the Trump administration unveiled a sweeping set of tariffs. A baseline 10% tariff applies to all imports from all countries unless specific exemptions are granted. Additional “reciprocal tariffs” target approximately 60 countries deemed the worst offenders, based on existing tariffs on U.S. goods, perceived trade barriers like currency manipulation, and subsidies to domestic industries. Figure 1 graphs the combined baseline plus reciprocal tariff rates across key countries. The rates range from 46% in Vietnam to 20% in the EU and span multiple regions, from Southeast Asia to China and Europe.
A History Lesson on U.S. Tariffs Over the Past Century
Tariffs are back in the spotlight, but they’ve been part of U.S. policy for over a century. Figure 2 graphs the average tariff rate on U.S. imports since 1891, calculated as the total amount of duties collected divided by the total value of imports. In 1899, the average tariff rate was 29%, a time when the U.S. relied heavily on tariffs for federal revenue and to protect domestic industries. Over time, tariff rates declined due to the rise of globalization and a shift from protectionism to more open and free trade. In recent years, the average rate was between 1% and 3%. However, the newly announced tariffs represent a turning point. The Yale Budget Lab estimates the average tariff rate will rise from less than 3% in 2024 to over 20%, the steepest level in nearly a century.
The Uncertain Impact of Tariffs on a Complex Global Economy
The new tariffs carry significant implications for financial markets and the economy, but their impact is difficult to predict given the complexity of global trade and the range of potential responses by countries. The timeline is also uncertain, and tariffs could remain in effect for weeks or years, depending on negotiations. Countries could retaliate with tariffs, leading to a global trade war. Economic effects like higher inflation and slower growth are possible but also uncertain. The new tariffs are only a few days old, and their impact will unfold gradually over months as supply chains adjust. In the near term, economists expect businesses to absorb some tariff costs, softening the impact. However, there is little consensus about how much they will absorb or how they will respond, such as pausing investment or holding back on hiring.
Focus On What You Can Control: Staying Disciplined with Your Long-Term Goals
The impact of today’s tariffs is uncertain, but history shows the economy and market usually adapt to changing environments. Rather than reacting to headlines and market volatility, the best course of action is to stay focused on your financial plan, maintain a well-diversified portfolio, and make decisions in line with your long-term goals.
Published by Market Desk Research and distributed by QuadCap Wealth Management, LLC
This commentary is furnished by QuadCap Wealth Management, LLC (“QuadCap”) on a confidential basis for the exclusive use of clients of QuadCap. and may not be disseminated, communicated, reproduced, redistributed or otherwise disclosed by the recipient to any other person without the prior written consent of QuadCap.
This document does not constitute an offer, solicitation or recommendation to sell or an offer to buy any securities, investment products or investment advisory services. Such an offer may only be made to prospective investors by means of delivery of an investment advisory agreement, subscription agreement and other similar materials that contain a description of the material terms relating to such investment, investment strategy or service. This presentation is being provided for general informational purposes only.
This presentation includes information based on data found in independent industry publications and other sources and is current as of the date of this presentation. Although we believe that the data are reliable, we have not sought, nor have we received, permission from any third-party to include their information in this presentation. Charts, tables and graphs contained in this document are not intended to be used to assist the reader in determining which securities to buy or sell or when to buy or sell securities. Opinions, estimates, and projections constitute the current judgment of QuadCap and are subject to change without notice.
References to any indices are for informational and general comparative purposes only. There are significant differences between such indices and the investment programs described in this presentation. References to indices do not suggest that the investment programs will, or are likely to, achieve returns, volatility, or other results similar to such indices. The performance data of various indices presented herein was current as of the date of the presentation.
Past performance is not indicative of future results and there can be no assurance that the future performance of any specific investment or investment strategy will be profitable or equal any corresponding index or benchmark.
Advisory Services are offered through QuadCap, an SEC registered investment advisor. QuadCap only transacts business in states where it is properly registered or is excluded or exempted from registration requirements. SEC registration is not an endorsement of the firm by the Commission and does not mean that QuadCap has attained a specific level of skill or ability.
The S&P 500 Index or Standard & Poor’s 500 Index is a market-capitalization-weighted index of 500 leading publicly traded companies in the U.S.
The Russell 2000 index measures the performance of approximately 2,000 small-cap US equities.
The Nasdaq 100 Index is a stock index of the 100 largest companies by modified market capitalization trading on Nasdaq exchanges.