Portfolio Allocation Drift: Is It Time to Rebalance Small Cap Exposure?
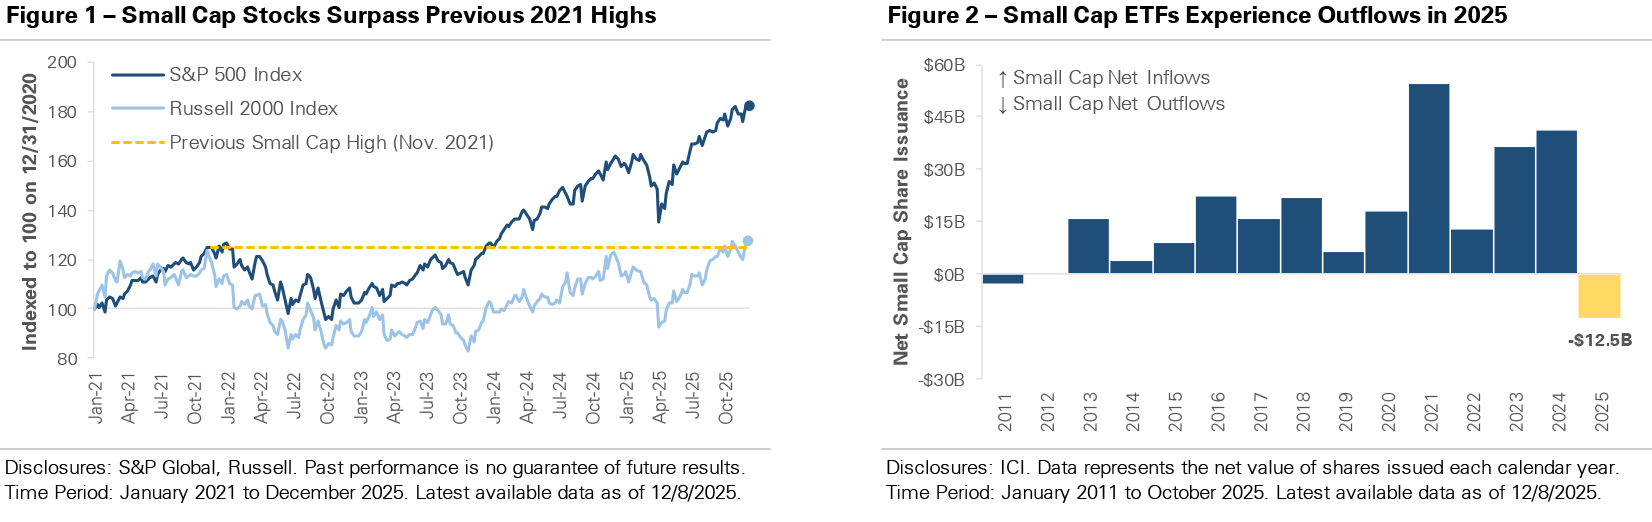
The S&P 500 has delivered strong returns over the past two years, setting 57 all-time highs in 2024 and adding more than 35 in 2025. Large-cap stocks have benefited from a combination of AI enthusiasm, resilient earnings, and strong economic growth. However, one corner of the market has been noticeably absent: small-cap stocks. While the S&P 500 climbed to new highs, Figure 1 shows the Russell 2000, an index of small-cap stocks, remained stuck below its November 2021 peak. The four-year drought ended this fall when small caps broke through to new highs, driven by expectations for additional Federal Reserve rate cuts.
Small-cap stocks are more sensitive to interest rates than their large-cap counterparts. Many smaller companies carry higher debt loads relative to their size and rely more heavily on borrowing to fund growth. When interest rates rise, financing costs squeeze profit margins. Conversely, when interest rates fall, the pressure eases as borrowing becomes cheaper. Small’s recent underperformance began when the Federal Reserve started its rate-hiking cycle in 2022, but it started to reverse this year in Q3. Expectations for additional rate cuts have breathed new life into small caps. Small-cap stocks gained +12% in Q3 compared to +7.8% for large caps, the largest relative outperformance since Q1 2021. The outperformance has continued into Q4, with small caps outperforming large caps by +1.0% quarter-to-date.
Beyond the Fed’s actions, valuations and investor flows tell a compelling story. Small-cap stocks trade at a significant discount to large caps, with the valuation gap at extremes. Figure 2 shows small-cap ETFs have posted net outflows this year, shedding roughly $12.5 billion through October 2025. It’s the first year of net outflows since 2011. The message is clear: small-cap stocks haven’t just underperformed; they’ve been actively avoided. Investors poured money into large-cap tech and AI-related names while small caps were left behind. The combination of depressed valuations and persistent outflows suggests these stocks are not just undervalued but genuinely unloved and under owned. This creates a potential opportunity for long-term investors.
What does this mean for your portfolio? If you’ve benefited from the S&P 500’s record run, the small-cap breakout raises a strategic question: Is it time to rebalance? The goal isn’t to time the market but to evaluate whether your portfolio has drifted too far toward large caps and whether adding exposure to small caps aligns with your long-term goals. Small caps bring diversification at a time when the S&P 500 is highly concentrated in a few mega-cap tech names. Small caps are more domestically focused, spread across a wider range of industries, and less dependent on the AI narrative. While they are more volatile than large caps, the investment case appears to be strengthening. Fed rate cuts favor smaller borrowers, small caps trade at a steep valuation discount, and investor positioning is light. The recent breakout to new highs could mark a turning point. For those with a long-term horizon, small caps might deserve consideration in 2026.
Important Disclosures
Published by Market Desk Research and distributed by QuadCap Wealth Management, LLC.
This client letter is being furnished by QuadCap Wealth Management, LLC (“QuadCap”) on a confidential basis for the exclusive use of clients of QuadCap. and may not be disseminated, communicated, reproduced, redistributed or otherwise disclosed by the recipient to any other person without the prior written consent of QuadCap.
This document does not constitute an offer, solicitation or recommendation to sell or an offer to buy any securities, investment products or investment advisory services. Such an offer may only be made to prospective investors by means of delivery of an investment advisory agreement, subscription agreement and other similar materials that contain a description of the material terms relating to such investment, investment strategy or service. This presentation is being provided for general informational purposes only.
This presentation includes information based on data found in independent industry publications and other sources and is current as of the date of this presentation. Although we believe that the data is reliable, we have not sought, nor have we received, permission from any third-party to include their information in this presentation. Charts, tables and graphs contained in this document are not intended to be used to assist the reader in determining which securities to buy or sell or when to buy or sell securities. Opinions, estimates, and projections constitute the current judgment of QuadCap and are subject to change without notice.
References to any indices are for informational and general comparative purposes only. There are significant differences between such indices and the investment programs described in this presentation. References to indices do not suggest that the investment programs will, or are likely to, achieve returns, volatility, or other results similar to such indices. The performance data of various indices presented herein was current as of the date of the presentation.
Past performance is not indicative of future results and there can be no assurance that the future performance of any specific investment or investment strategy will be profitable or equal any corresponding index or benchmark. The performance information shown herein is based on total returns with dividends reinvested and does not reflect the deduction of advisory and/or other fees normally incurred in the management of a portfolio.
Advisory Services are offered through QuadCap, an SEC registered investment advisor. QuadCap only transacts business in states where it is properly registered or is excluded or exempted from registration requirements. SEC registration is not an endorsement of the firm by the Commission and does not mean that QuadCap has attained a specific level of skill or ability.
The S&P 500 Index or Standard & Poor’s 500 Index is a market-capitalization-weighted index of 500 leading publicly traded companies in the U.S.
The Russell 2000 index measures the performance of approximately 2,000 small-cap US equities.
The Nasdaq 100 Index is a stock index of the 100 largest companies by modified market capitalization trading on Nasdaq exchanges.
The Dow Jones Industrial Average, or simply the Dow, is a stock market index that indicates the value of 30 large, publicly owned companies based in the United States, and how they have traded in the stock market during various periods of time. These 30 companies are also included in the S&P 500 Index. The value of the Dow is not a weighted arithmetic mean and does not represent its component companies’ market capitalization, but rather the sum of the price of one share of stock for each component company. The sum is corrected by a factor which changes whenever one of the component stocks has a stock split or stock dividend, so as to generate a consistent value for the index.
The Russell 1000 Index is a U.S. stock market index that tracks the largest 1,000 stocks in the Russell 3000 Index, which represent about 93% of the total market capitalization of that index.