1Q 2026 Recap & 2Q 2026 Outlook
Key Updates on the Economy & Markets
The first quarter was eventful for markets. Stocks traded higher to start the year, with the S&P 500 posting a modest gain in January. However, the market traded lower in March due to escalating geopolitical tensions in the Middle East and the Strait of Hormuz closure, which led to a spike in oil prices. The S&P 500 returned -4.3%, but despite the late-quarter volatility, there were bright spots. The average S&P 500 stock outperformed the broad index by nearly +5% as market leadership broadened, and manufacturing data showed signs of improvement. In this letter, we recap the key developments from Q1, discuss how higher oil prices impacted rate cut expectations, highlight how diversification benefited investors, and look ahead to Q2.
Higher Oil Prices Impact Rate Cut Expectations
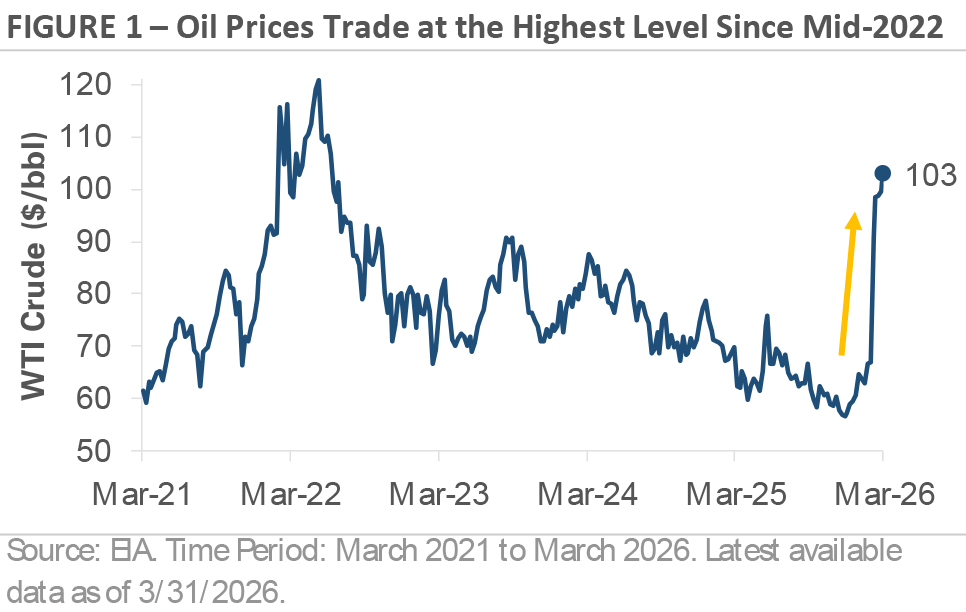
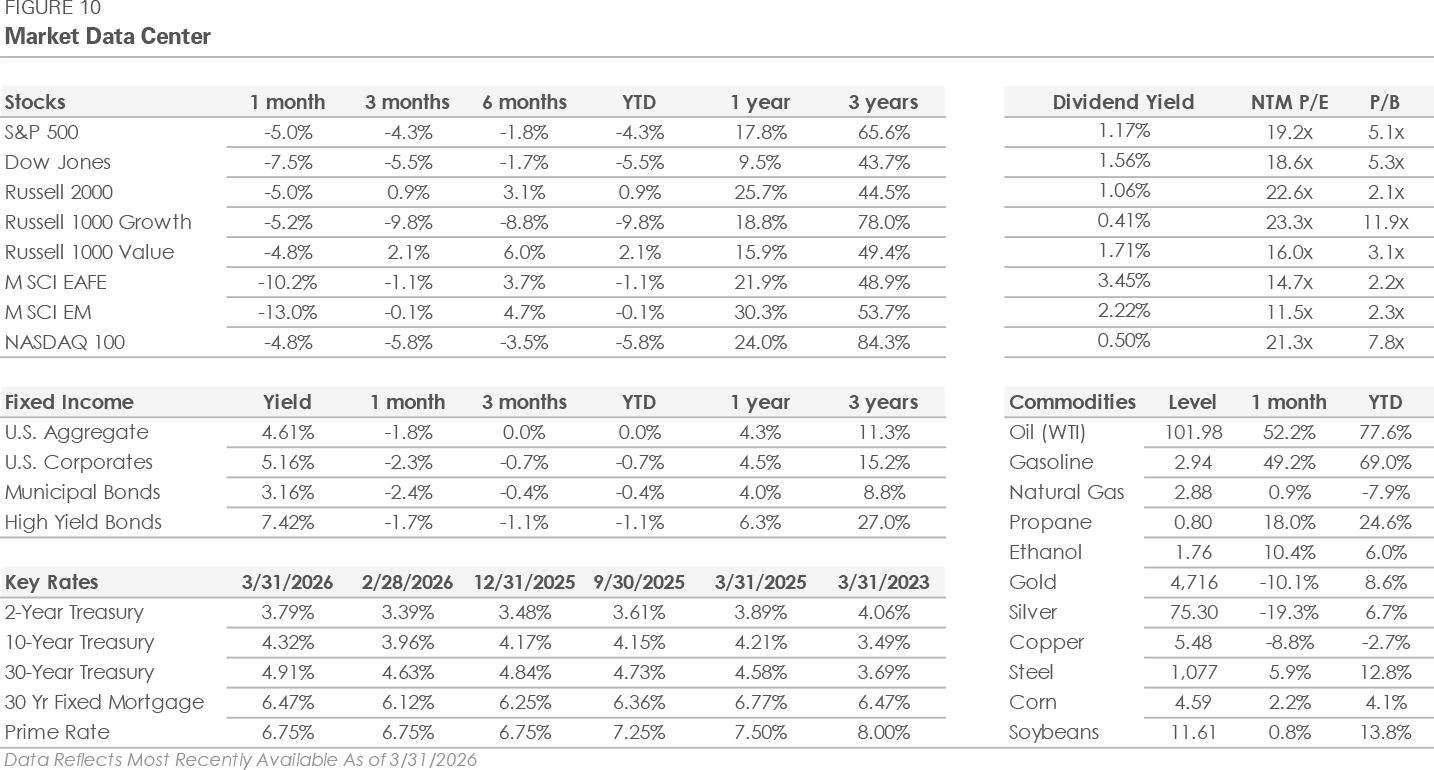
Oil prices rose in Q1 as geopolitical tensions escalated over the course of the quarter. In January, crude oil gained nearly +13% due to supply concerns related to Venezuelan output and Middle East tensions. Prices rose another +4% in February as geopolitical tensions continued to build, followed by a sharp escalation in March. The U.S.-Iran conflict and the closure of the Strait of Hormuz, a chokepoint for roughly 20% of global oil flows, sent crude oil prices surging nearly +50% in a single month. The price of oil rose more than +70% in Q1, with Figure 1 showing oil trading at the highest level since mid-2022.
The rise in oil prices matters due to its connection to inflation and Federal Reserve policy. Higher energy costs can feed into the prices that consumers and businesses pay, and the average price of a gallon of gasoline has already risen nearly +$1.00 since late February. Rising oil prices are particularly relevant right now because inflation was already firming before the conflict. The Federal Reserve’s preferred inflation measure, Core PCE, remains near 3%, and producer-level price inflation has been rising in recent months.
The combination of rising oil prices and the risk of renewed inflation pressure led to a shift in rate cut expectations. At the start of 2026, the market expected the Federal Reserve to cut rates two to three times by year end. However, the forecast changed as the market steadily priced out rate cuts during the quarter. Those rate cuts were completely removed by the end of the quarter, with the possibility of a rate hike being discussed as oil prices spiked in March.
The situation remains fluid heading into Q2. As of quarter-end, the Strait of Hormuz is still closed, and negotiations are ongoing. Oil trades near $100 per barrel, an indication that the market expects the disruption to continue. The April and May inflation data will be among the first reports to capture the impact of higher energy prices, and the market will be searching for clarity around inflation outlook and interest rate policy. While the market waits for more data, headlines and developments in the Middle East will likely impact how stocks and bonds trade in early Q2.
Investors Benefited from Diversification in Q1
One of the quarter’s most significant developments was the performance gap across different areas of the stock market. While the S&P 500 declined by -4.3%, diversified portfolios fared differently. Figure 2 compares three ways to measure the U.S. stock market. The S&P 500 weights companies by market value, meaning the largest companies have the most influence on the index’s return. The equal-weight S&P 500 assigns the same weight to each company, making it a proxy for the average stock’s return. The Russell 2000 tracks an index of small-cap stocks, and the Nasdaq 100 tracks an index of leading tech companies.
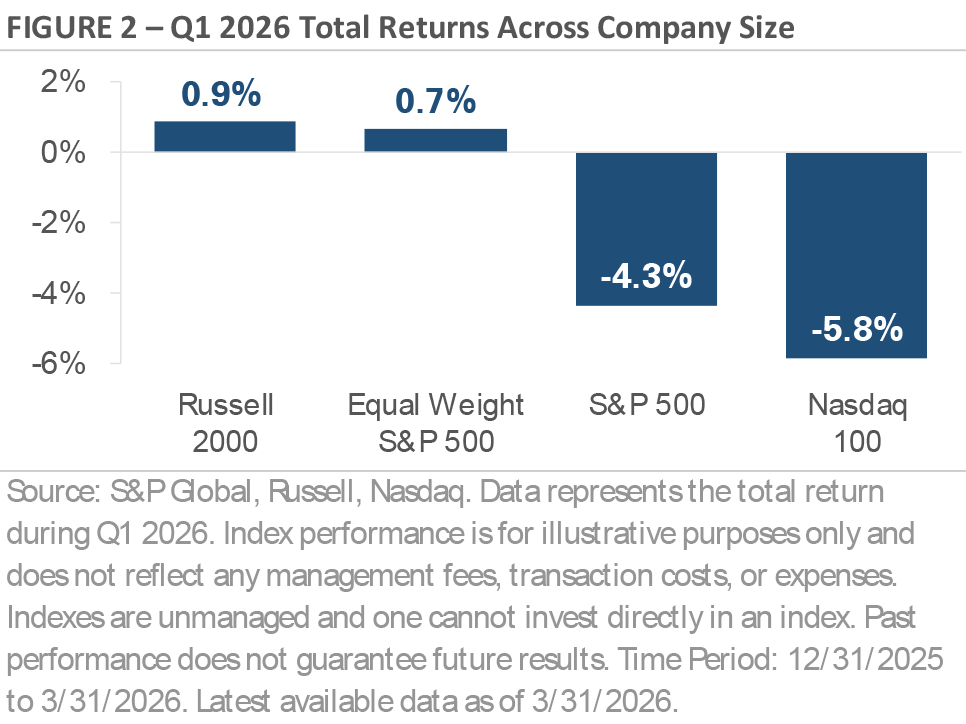
The chart shows a significant gap across company size. The Russell 2000 and equal-weight S&P 500 each gained nearly +1% in Q1, outperforming the S&P 500’s -4.3% decline, an indication that smaller companies outperformed in Q1. The Nasdaq 100 returned -5.8% for the full quarter. Investors with diversified exposure across company sizes, styles, and geographies experienced a more moderate quarter than the S&P 500 return suggests.
The gap shows a clear shift in market leadership in early 2026, with multiple catalysts driving the market rotation. In January, investors started moving away from the concentrated mega-cap trade that dominated the past two years, and the average stock quietly outperformed the index. The rotation accelerated in February as concerns about disruption from artificial intelligence spread across the market, particularly among software companies that make up a large portion of growth-style indexes. The March market volatility narrowed the performance gap, but it didn’t reverse it.
The result was a quarter in which market leadership shifted dramatically. The companies and sectors that led the market in recent years weren’t the ones that outperformed in Q1. The market rotation showed the benefit of diversification. It didn’t eliminate market volatility, but it helped manage it by spreading exposure across different areas of the market.
Manufacturing Data & Concerns of AI Disruption
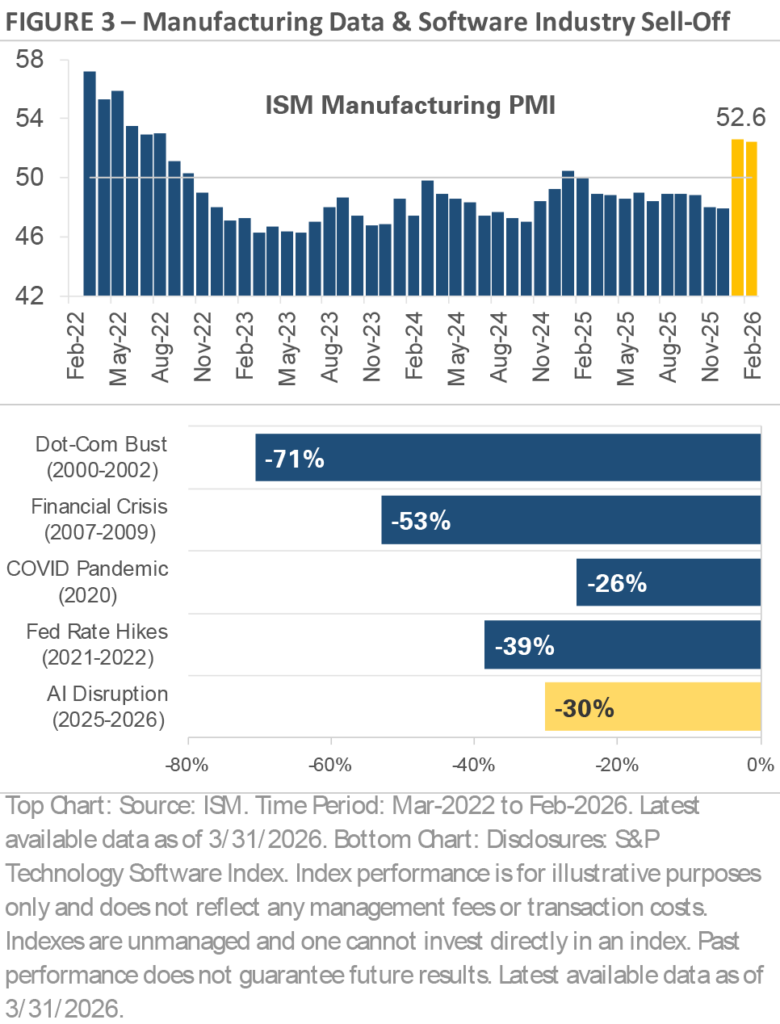
Two competing themes stood out during the quarter, both of which contributed to the rotation. The first theme was related to manufacturing activity. The top section in Figure 3 graphs the ISM Manufacturing Index, which surveys purchasing managers at U.S. factories to gauge whether the sector is expanding or contracting. A reading above 50 signals expansion, while a reading below 50 signals contraction. After spending nearly a year below 50, the index crossed into expansion in February and held that level in March. The rise above 50 suggests the manufacturing sector, which has been a soft spot in the economy since 2022, was gaining traction before the conflict. Equity markets reflected that shift, with the Industrials sector setting a new all-time high in late February.
The economic data released in Q1 primarily covered activity through February, before the conflict and surge in oil prices. The data suggest the manufacturing sector entered the conflict with underlying momentum, which could cushion the impact. The March stock market sell-off reflected expectations about the potential impact of higher oil prices on future conditions rather than current weakness. Incoming data over the next several months will start to measure the real economic impact, and markets will be looking for clarity on the future outlook.
The second theme was related to AI. For the past two years, AI has been seen as a productivity tool to help existing companies do more with less. However, multiple product launches in January and February changed the way investors view AI. The market started to price AI as a potential replacement for entire categories of professional services, not just a tool to make companies more efficient.
The software industry was hit particularly hard and has declined nearly -30% from its peak last October, one of the largest non-recessionary drawdowns in over 30 years. The bottom chart in Figure 3 puts the decline in historical context alongside the other major software selloffs. The two largest drawdowns before the current one, the dot-com bust and the 2008 financial crisis, both occurred during recessions when corporate earnings were declining and businesses were cutting spending. The 2022 sell-off, which was driven by the Fed’s aggressive rate-hiking cycle, was the first major non-recessionary decline and saw software stocks fall nearly -40%. The current drawdown, at nearly -30%, surpasses the COVID pandemic. The broader question of how AI will reshape professional services and the enterprise software industry is far from resolved, and its effects may continue to surface across the market as AI tools evolve.
Equity Market Recap – Looking Beyond the Index
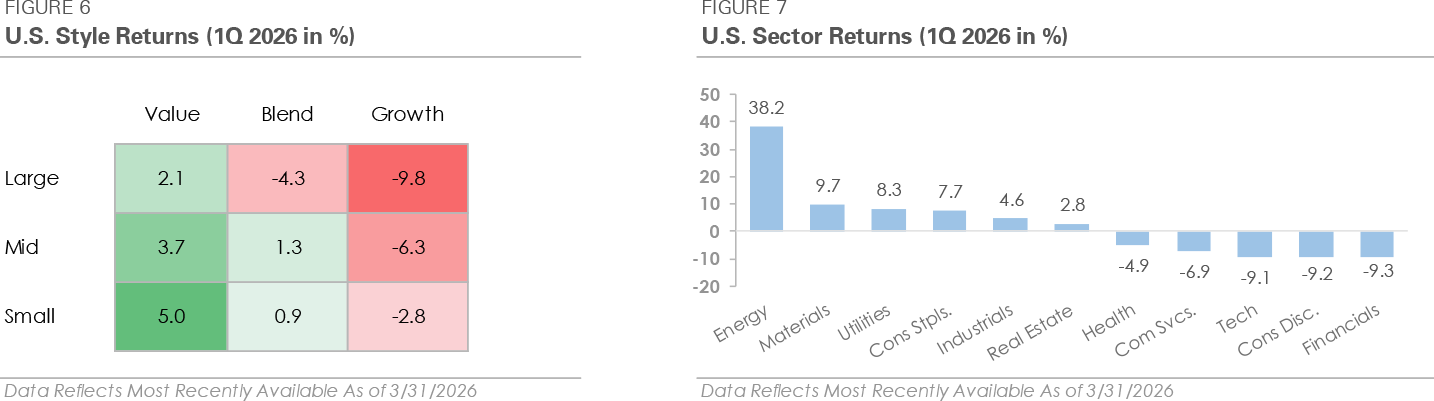
The S&P 500 declined -4.3% in Q1, ending its three-quarter winning streak. The decline was concentrated in March, while January was modestly positive and February was flat. As discussed earlier, company size impacted returns. The largest companies, particularly those in the technology sector, drove the index-level decline. The Nasdaq, which has exposure to many of the leading mega-cap tech companies, declined nearly -6%. The sell-off weighed on growth stocks, which declined nearly -10%, while Value gained +2.1%. Value outperformed Growth in each month, a level of consistency that is notable regardless of the market environment. Small-cap stocks held up better despite the volatility, with the Russell 2000 Index gaining nearly +1%.
Sector performance reflected the quarter’s key themes. Energy was the top-performing sector with a +38% return, benefiting from the sharp rise in oil prices. Materials, Utilities, and Consumer Staples each gained over +7.5%, with the Industrial and Real Estate sectors also trading higher. In contrast, Financials, Consumer Discretionary, and Technology each declined over -9%. The gap between the top and bottom sectors was wide, with over 45% separating Energy and Financials. Six of the eleven S&P 500 sectors outperformed the broad index, a sharp contrast to recent years when a few sectors drove the S&P 500’s gains.
Shifting focus outside the U.S., international outperformed for a second consecutive quarter. International equities finished the quarter with a gain of nearly +1%, while the S&P 500 fell -4.3%, a 5% gap. International’s outperformance was concentrated in January and February, while March was more challenging as international stocks declined alongside U.S. stocks. Emerging markets returned -0.1% for the full quarter, with relative strength in Latin America tied to rising energy prices. Developed markets returned -1.1%, with Europe and Asia under pressure due to their reliance on energy imports from the Middle East.
Credit Recap – Bonds Navigate a Volatile Quarter
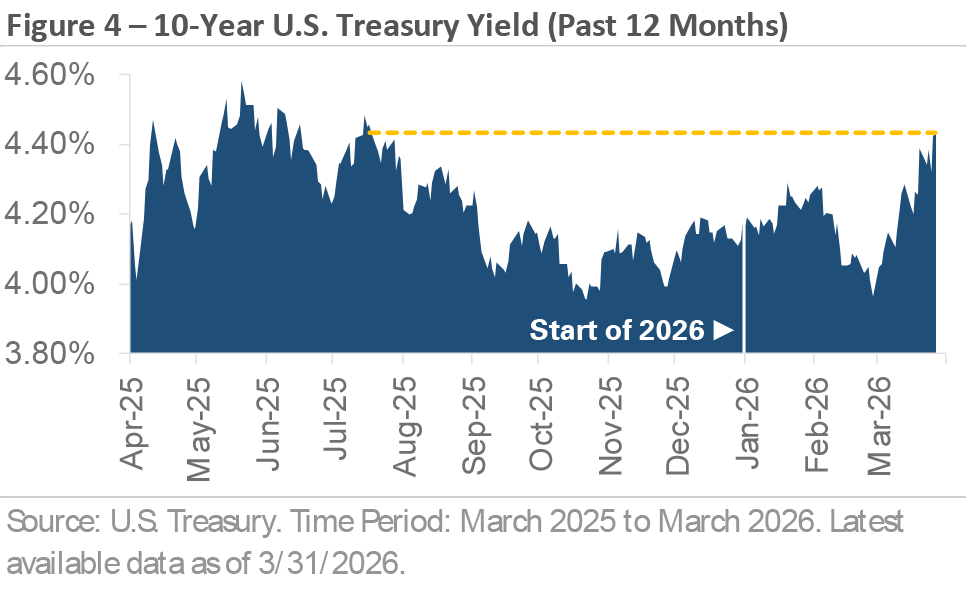
The bond market also experienced a volatile quarter as Treasury yields reacted to the changing landscape. Figure 4 graphs the 10-year U.S. Treasury yield in Q1. Interest rates rose in January as the administration issued another round of tariff threats, while February and March were nearly mirror images. Yields fell sharply in February as concerns about AI disruption caused stocks to trade lower, followed by a sharp reversal higher in March as oil prices spiked and the probability of rate cuts declined. The 10-year yield ended the quarter near 4.32%, the highest since June 2025, after briefly touching 4.45% in late March. The 2-year yield ended near 3.79%, up nearly +0.35%. The rise in shorter-term yields reflected the shift in rate cut expectations, as markets adjusted from pricing in rate cuts to the possibility that rates may remain at current levels for longer.
The rise in interest rates weighed on bond returns. The Bloomberg U.S. Aggregate Bond Index was flat in Q1 as Treasury yields rose, after returning +1% or more in the prior four quarters. Corporate bonds modestly underperformed higher-quality bonds like U.S. Treasuries due to their credit risk exposure. Credit spreads, which measure the difference in yield between corporate and government bonds, widened during the quarter. The high yield spread widened to its highest level since early 2025, reflecting increased caution among investors and uncertainty about the impact of higher energy prices on the economy and corporate earnings. However, despite the recent widening, corporate credit spreads remain well below levels reached during past recessions and financial crises. The market is pricing in caution, but it’s not signaling stress.
2026 Outlook – What to Watch in Q2
The key development to watch heading into Q2 is the situation in the Middle East and its impact on oil prices. The Strait of Hormuz was still closed at quarter-end with negotiations ongoing. Progress toward a resolution would likely ease energy costs and reduce inflation pressures, giving the Federal Reserve more flexibility on interest rate policy. A prolonged disruption would give higher oil prices more time to work their way through to the economy, potentially affecting consumer spending and business investment while keeping inflation elevated.
The connection between oil prices, inflation, and Federal Reserve policy is the thread that tied the quarter together. Higher oil prices contributed to the shift in rate cut expectations, and the upcoming April and May inflation data will be the first reports to capture the full impact of higher energy costs. How those readings come in will shape the outlook for interest rates and the broader economy.
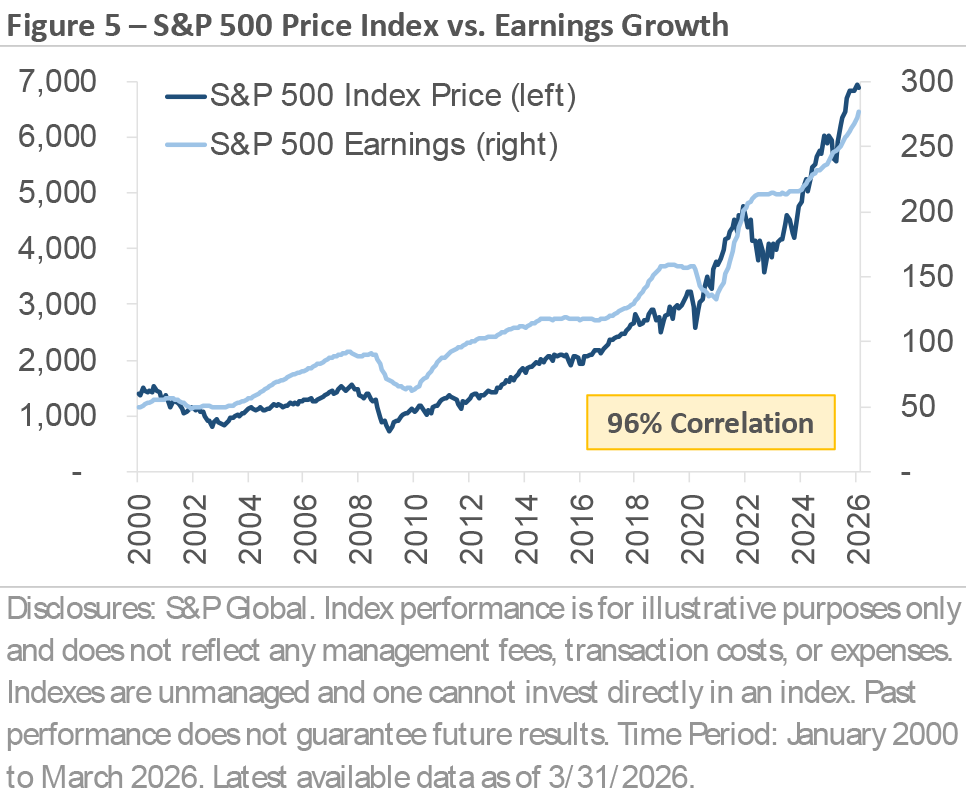
While the market’s decline in Q1 drew attention, it’s worth stepping back to look at the bigger picture. Figure 5 shows the relationship between the S&P 500’s price and its earnings over the past 26 years. The two have moved together with a 96% correlation. When earnings rise, stock prices generally follow. When earnings decline, as they did during the 2001 recession, the 2008 financial crisis, and the 2020 pandemic, stock prices tend to fall. What stands out about the current environment is that earnings estimates have continued to rise even as the S&P 500 has pulled back. Analysts still expect earnings growth in the coming quarters, and profit margins remain healthy. The market’s decline has been driven by uncertainty around oil prices, inflation, and Fed policy, not by a deterioration in the fundamentals that drive stock prices over time. That distinction is important for long-term investors.
The first quarter also reinforced the importance of portfolio diversification. The areas of the market that led over the past two years underperformed in Q1. Investors with broad exposure across company sizes, investment styles, sectors, and geographies generally experienced a more moderate decline than the S&P 500. Staying invested through periods of market volatility, maintaining portfolio diversification, and keeping a long-term perspective remains one of the most effective approaches for building wealth.
This Quarter in Numbers
Important Disclosures
Published by Market Desk Research and distributed by QuadCap Wealth Management, LLC.
This client letter is being furnished by QuadCap Wealth Management, LLC (“QuadCap”) on a confidential basis for the exclusive use of clients of QuadCap. and may not be disseminated, communicated, reproduced, redistributed or otherwise disclosed by the recipient to any other person without the prior written consent of QuadCap.
This document does not constitute an offer, solicitation or recommendation to sell or an offer to buy any securities, investment products or investment advisory services. Such an offer may only be made to prospective investors by means of delivery of an investment advisory agreement, subscription agreement and other similar materials that contain a description of the material terms relating to such investment, investment strategy or service. This presentation is being provided for general informational purposes only.
This presentation includes information based on data found in independent industry publications and other sources and is current as of the date of this presentation. Although we believe that the data are reliable, we have not sought, nor have we received, permission from any third-party to include their information in this presentation. Charts, tables and graphs contained in this document are not intended to be used to assist the reader in determining which securities to buy or sell or when to buy or sell securities. Opinions, estimates, and projections constitute the current judgment of QuadCap and are subject to change without notice.
References to any indices are for informational and general comparative purposes only. There are significant differences between such indices and the investment programs described in this presentation. References to indices do not suggest that the investment programs will, or are likely to, achieve returns, volatility, or other results similar to such indices. The performance data of various indices presented herein was current as of the date of the presentation.
Past performance is not indicative of future results and there can be no assurance that the future performance of any specific investment or investment strategy will be profitable or equal any corresponding index or benchmark. The performance information shown herein is based on total returns with dividends reinvested and does not reflect the deduction of advisory and/or other fees normally incurred in the management of a portfolio. Stock performance and fundamental data is based on the following instruments: SPDR S&P 500 ETF (SPY), SPDR Dow Jones ETF (DIA), iShares Russell 2000 ETF (IWM), iShares Russell 1000 Growth ETF (IWF), iShares Russell 1000 Value ETF (IWD), iShares MSCI EAFE ETF (EFA), iShares MSCI Emerging Markets ETF (EEM), Invesco QQQ Trust (QQQ). Fixed Income performance is based on the following instruments: iShares Core U.S. Aggregate Bond ETF (AGG), iShares Investment Grade Corporate ETF (LQD), iShares National Muni Bond ETF (MUB), iShares High Yield Corporate ETF (HYG). Fixed Income yields and key rates are based on the following instruments: Bloomberg US Aggregate, ICE BofA US Corporate, ICE BofA US Municipal Securities, ICE BofA US High Yield, 2 Year US Benchmark Bond, 10 Year US Benchmark Bond, 30 Year US Benchmark Bond, 30 Year US Fixed Mortgage Rate, US Prime Rate. Commodity prices are based on the following instruments: Crude Oil WTI (NYM $/bbl), Gasoline Regular U.S. Gulf Coast ($/gal), Natural Gas (NYM $/mmbtu), Propane (NYM $/gal), Ethanol (CRB $/gallon), Gold (NYM $/ozt), Silver (NYM $/ozt), Copper NYMEX ($/lb), U.S. Midwest Domestic Hot-Rolled Coil Steel (NYM $/st), Corn (CBT $/bu), Soybeans (Chicago $/bu). U.S. Style performance is based on the following instruments: iShares Russell 1000 Value ETF (IWD), SPDR S&P 500 ETF Trust (SPY), iShares Russell 1000 Growth ETF (IWF), iShares Russell Mid-Cap Value ETF (IWS), iShares Russell Midcap ETF (IWR), iShares Russell Mid-Cap Growth ETF (IWP), iShares Russell 2000 Value ETF (IWN), iShares Russell 2000 ETF (IWM), iShares Russell 2000 Growth ETF (IWO). U.S. Sector performance is based on the following instruments: Consumer Discretionary Sector SPDR ETF (XLY), Consumer Staples Sector SPDR ETF (XLP), Energy Sector SPDR ETF (XLE), Financial Sector SPDR ETF (XLF), Health Care Sector SPDR ETF (XLV), Industrial Sector SPDR ETF (XLI), Materials Sector SPDR ETF (XLB), Technology Sector SPDR ETF (XLK), Communication Services Sector SPDR ETF (XLC), Utilities Sector SPDR ETF (XLU), Real Estate Sector SPDR ETF (XLRE).
Advisory Services are offered through QuadCap, an SEC registered investment advisor. QuadCap only transacts business in states where it is properly registered or is excluded or exempted from registration requirements. SEC registration is not an endorsement of the firm by the Commission and does not mean that QuadCap has attained a specific level of skill or ability.
The S&P 500 Index or Standard & Poor’s 500 Index is a market-capitalization-weighted index of 500 leading publicly traded companies in the U.S.
The Russell 2000 index measures the performance of approximately 2,000 small-cap US equities.
The MSCI EAFE Index is a stock market index that measures the performance of large- and mid-cap companies across 21 developed markets countries around the world. Canada and the USA are not included.
The MSCI Emerging Markets Index captures large and mid cap representation across 24 Emerging Markets (EM) countries.
The Nasdaq 100 Index is a stock index of the 100 largest companies by modified market capitalization trading on Nasdaq exchanges.
The Russell 1000 Growth index is an index that tracks large cap, growth stocks. This benchmark is important for investors that might tilt their investments towards large cap growth. Growth stocks, in comparison to value stocks, are considered companies with a more growth potential, and a higher risk profile.
The Russell 1000 Value index is an index that tracks large cap, value stocks. This benchmark is important for investors that might tilt their investments towards large cap value. Value stocks, in comparison to growth stocks, are considered companies with a stable cash flow, and more mature business model.
The Dow Jones Industrial Average, or simply the Dow, is a stock market index that indicates the value of 30 large, publicly owned companies based in the United States, and how they have traded in the stock market during various periods of time. These 30 companies are also included in the S&P 500 Index. The value of the Dow is not a weighted arithmetic mean and does not represent its component companies’ market capitalization, but rather the sum of the price of one share of stock for each component company. The sum is corrected by a factor which changes whenever one of the component stocks has a stock split or stock dividend, so as to generate a consistent value for the index.
The Bloomberg US Aggregate Bond Index is used as a benchmark for investment grade bonds within the United States. This index is important as a benchmark for someone wanting to track their fixed income asset allocation.
The Bloomberg US Corporate Index covers performance for United States corporate bonds. This index serves as an important benchmark for portfolios that include exposure to investment grade corporate bonds.
The Bloomberg US Corporate High Yield Index covers performance for United States high yield corporate bonds. This index serves as an important benchmark for portfolios that include exposure to riskier corporate bonds that might not necessarily be investment grade.
Treasuries, also known as Treasury securities, are debt obligations issued by the United States government. They are used to raise cash needed to fund government operations and help finance the federal deficit. Treasuries are backed by the full faith and credit of the US government, making them one of the safest investments. They are an important instrument in monetary policy, allowing central banks to control the money supply.
The Prime Rate is the interest rate that commercial banks charge their most creditworthy corporate customers. The prime rate is derived from the federal funds rate, usually using fed funds + 3 as the formula.