Market Leadership Broadens as Rotation Continues
Monthly Market Summary
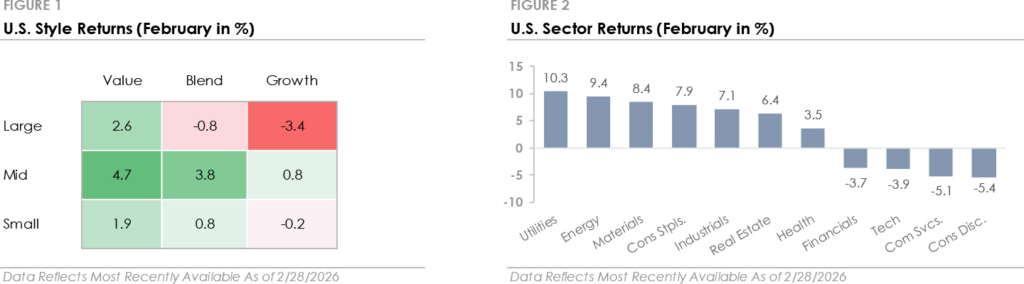
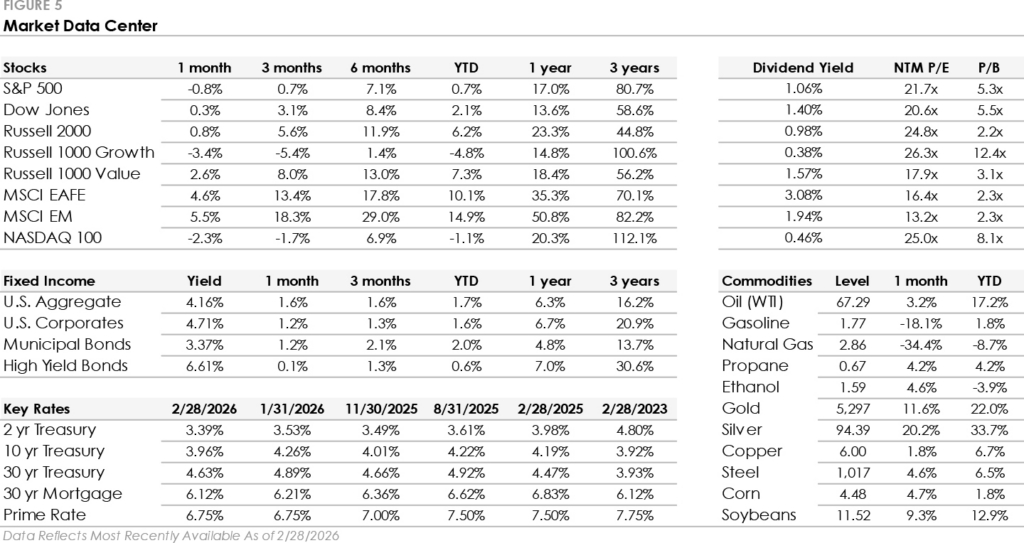
- The S&P 500 Index declined -0.8% in February, but the headline masked broad underlying strength. The equal-weighted S&P 500 gained +3.5%, Large Cap Value rose +2.6%, and the Russell 2000 added +0.8%, as the rotation toward smaller and more value-oriented companies continued. In contrast, Large Cap Growth declined -3.4% and the Nasdaq fell -2.3% as technology stocks came under pressure.
- Utilities led all S&P 500 sectors with a +10.3% return, followed by Energy (+9.4%), Materials (+8.4%), Consumer Staples (+7.9%), and Industrials (+7.1%). Seven sectors outperformed the index, while the remaining four underperformed.
- Bonds traded higher as Treasury yields declined, with the U.S. Bond Aggregate returning +1.6%. Corporate bonds traded higher, with investment-grade outperforming high-yield, but underperformed as credit spreads widened.
- International stocks outperformed the S&P 500 for a third consecutive month, with Developed Markets gaining +4.6% and Emerging Markets returning +5.5%.
Market Leadership Continues to Broaden Amid Questions About AI’s Impact
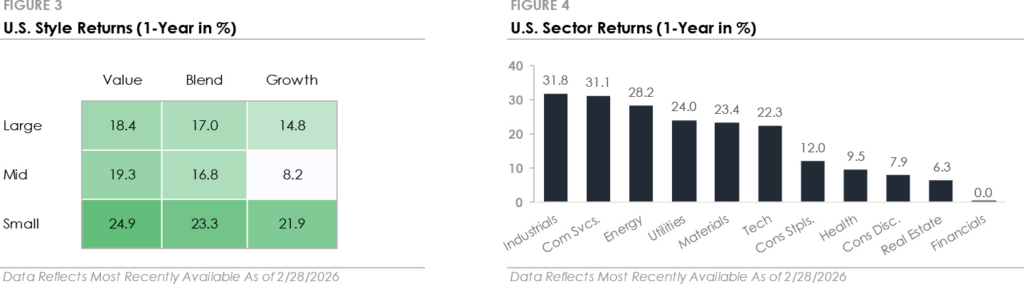
The rotation away from mega-cap tech stocks that started in January extended into February. While the S&P 500 traded lower, the average stock, as measured by the equal-weighted index, gained over +3%. The rotation was broad-based: small caps outperformed large caps, value beat growth, seven of eleven sectors beat the S&P 500, and international stocks outpaced U.S. stocks. Market leadership is broadening after a long period in which a small group of mega-cap tech stocks drove most of the market’s gains, and diversified portfolios are benefiting from the rotation.
The technology sector’s weakness was tied to concerns that artificial intelligence will impact, and potentially disrupt, current business models. A wave of AI product launches caused investors to rethink not only the potential winners, but also which industries could face disruption, such as software, consulting, real estate services, freight brokers, and other industries where AI capabilities are advancing rapidly. The selling and volatility were most pronounced early in the month but later stabilized as the narrative shifted toward a more balanced view of AI as a tool that enhances existing businesses rather than replaces them. The disruption fears eased into month-end, but investors are likely to remain focused on AI’s impact on industries beyond technology.
Bonds & Gold Trade Higher as Investors Seek Stability
February was a strong month for bonds, as the 10-year Treasury yield fell nearly -0.30% to end the month below 4.00%, the lowest since October. The decline in Treasury yields drove the bond market rally, with longer-maturity and higher-quality bonds outperforming as investors sought stability amid tech sector volatility, trade policy uncertainty tied to the Supreme Court’s tariff ruling, and rising geopolitical tensions with Iran. Long-duration Treasuries gained +4.1%, and mortgage-backed securities returned +1.6%, both outperforming the broad U.S. Bond Aggregate Index.
The bond rally is notable because it occurred even as expectations for interest rate cuts were pushed further out. The Federal Reserve held interest rates steady at its January meeting after cutting in December, and the market doesn’t expect the next rate cut until June, at the earliest. The distinction is important: falling Treasury yields reflected investor demand for lower volatility assets amid the tech sector sell-off and geopolitical tensions, not a signal that economic conditions are deteriorating. Gold gained more than +10% in February, reflecting the same demand for portfolio protection.
Minutes from the Fed’s January meeting signaled a continued focus on controlling inflation, and the economic data supports the Fed’s patience. The labor market added +130,000 jobs in January, the unemployment rate declined to 4.3%, and an index of manufacturing activity crossed back into expansion for the first time in nearly a year. Inflation continues to ease, with core CPI rising at a +2.5% annual rate, the slowest since early 2021. The combination of steady growth and cooling inflation gives the Fed room to remain on hold. While the market still expects the Fed to cut twice this year, the start date keeps drifting later.
Where Markets Stand Today
February was a busy month filled with AI headlines, shifting market leadership, and policy uncertainty. But beneath the surface, the economic backdrop remains stable, and the Federal Reserve remains patient. As leadership broadens beyond a narrow group of mega-cap stocks, diversified portfolios are beginning to benefit from a healthier market structure.
This Month in Numbers
Important Disclosures
Published by Market Desk Research and distributed by QuadCap Wealth Management, LLC.
This client letter is being furnished by QuadCap Wealth Management, LLC (“QuadCap”) on a confidential basis for the exclusive use of clients of QuadCap. and may not be disseminated, communicated, reproduced, redistributed or otherwise disclosed by the recipient to any other person without the prior written consent of QuadCap.
This document does not constitute an offer, solicitation or recommendation to sell or an offer to buy any securities, investment products or investment advisory services. Such an offer may only be made to prospective investors by means of delivery of an investment advisory agreement, subscription agreement and other similar materials that contain a description of the material terms relating to such investment, investment strategy or service. This presentation is being provided for general informational purposes only.
This presentation includes information based on data found in independent industry publications and other sources and is current as of the date of this presentation. Although we believe that the data are reliable, we have not sought, nor have we received, permission from any third-party to include their information in this presentation. Charts, tables and graphs contained in this document are not intended to be used to assist the reader in determining which securities to buy or sell or when to buy or sell securities. Opinions, estimates, and projections constitute the current judgment of QuadCap and are subject to change without notice.
References to any indices are for informational and general comparative purposes only. There are significant differences between such indices and the investment programs described in this presentation. References to indices do not suggest that the investment programs will, or are likely to, achieve returns, volatility, or other results similar to such indices. The performance data of various indices presented herein was current as of the date of the presentation.
Past performance is not indicative of future results and there can be no assurance that the future performance of any specific investment or investment strategy will be profitable or equal any corresponding index or benchmark. The performance information shown herein is based on total returns with dividends reinvested and does not reflect the deduction of advisory and/or other fees normally incurred in the management of a portfolio. Stock performance and fundamental data is based on the following instruments: SPDR S&P 500 ETF (SPY), SPDR Dow Jones ETF (DIA), iShares Russell 2000 ETF (IWM), iShares Russell 1000 Growth ETF (IWF), iShares Russell 1000 Value ETF (IWD), iShares MSCI EAFE ETF (EFA), iShares MSCI Emerging Markets ETF (EEM), Invesco QQQ Trust (QQQ). Fixed Income performance is based on the following instruments: iShares Core U.S. Aggregate Bond ETF (AGG), iShares Investment Grade Corporate ETF (LQD), iShares National Muni Bond ETF (MUB), iShares High Yield Corporate ETF (HYG). Fixed Income yields and key rates are based on the following instruments: Bloomberg US Aggregate, ICE BofA US Corporate, ICE BofA US Municipal Securities, ICE BofA US High Yield, 2 Year US Benchmark Bond, 10 Year US Benchmark Bond, 30 Year US Benchmark Bond, 30 Year US Fixed Mortgage Rate, US Prime Rate. Commodity prices are based on the following instruments: Crude Oil WTI (NYM $/bbl), Gasoline Regular U.S. Gulf Coast ($/gal), Natural Gas (NYM $/mmbtu), Propane (NYM $/gal), Ethanol (CRB $/gallon), Gold (NYM $/ozt), Silver (NYM $/ozt), Copper NYMEX ($/lb), U.S. Midwest Domestic Hot-Rolled Coil Steel (NYM $/st), Corn (CBT $/bu), Soybeans (Chicago $/bu). U.S. Style performance is based on the following instruments: iShares Russell 1000 Value ETF (IWD), SPDR S&P 500 ETF Trust (SPY), iShares Russell 1000 Growth ETF (IWF), iShares Russell Mid-Cap Value ETF (IWS), iShares Russell Midcap ETF (IWR), iShares Russell Mid-Cap Growth ETF (IWP), iShares Russell 2000 Value ETF (IWN), iShares Russell 2000 ETF (IWM), iShares Russell 2000 Growth ETF (IWO). U.S. Sector performance is based on the following instruments: Consumer Discretionary Sector SPDR ETF (XLY), Consumer Staples Sector SPDR ETF (XLP), Energy Sector SPDR ETF (XLE), Financial Sector SPDR ETF (XLF), Health Care Sector SPDR ETF (XLV), Industrial Sector SPDR ETF (XLI), Materials Sector SPDR ETF (XLB), Technology Sector SPDR ETF (XLK), Communication Services Sector SPDR ETF (XLC), Utilities Sector SPDR ETF (XLU), Real Estate Sector SPDR ETF (XLRE).
Advisory Services are offered through QuadCap, an SEC registered investment advisor. QuadCap only transacts business in states where it is properly registered or is excluded or exempted from registration requirements. SEC registration is not an endorsement of the firm by the Commission and does not mean that QuadCap has attained a specific level of skill or ability.
The S&P 500 Index or Standard & Poor’s 500 Index is a market-capitalization-weighted index of 500 leading publicly traded companies in the U.S.
The Russell 2000 index measures the performance of approximately 2,000 small-cap US equities.
The MSCI EAFE Index is a stock market index that measures the performance of large- and mid-cap companies across 21 developed markets countries around the world. Canada and the USA are not included.
The MSCI Emerging Markets Index captures large and mid cap representation across 24 Emerging Markets (EM) countries.
The Nasdaq 100 Index is a stock index of the 100 largest companies by modified market capitalization trading on Nasdaq exchanges.
The Russell 1000 Growth index is an index that tracks large cap, growth stocks. This benchmark is important for investors that might tilt their investments towards large cap growth. Growth stocks, in comparison to value stocks, are considered companies with a more growth potential, and a higher risk profile.
The Russell 1000 Value index is an index that tracks large cap, value stocks. This benchmark is important for investors that might tilt their investments towards large cap value. Value stocks, in comparison to growth stocks, are considered companies with a stable cash flow, and more mature business model.
The Dow Jones Industrial Average, or simply the Dow, is a stock market index that indicates the value of 30 large, publicly owned companies based in the United States, and how they have traded in the stock market during various periods of time. These 30 companies are also included in the S&P 500 Index. The value of the Dow is not a weighted arithmetic mean and does not represent its component companies’ market capitalization, but rather the sum of the price of one share of stock for each component company. The sum is corrected by a factor which changes whenever one of the component stocks has a stock split or stock dividend, so as to generate a consistent value for the index.
The Bloomberg US Aggregate Bond Index is used as a benchmark for investment grade bonds within the United States. This index is important as a benchmark for someone wanting to track their fixed income asset allocation.
The Bloomberg US Corporate Index covers performance for United States corporate bonds. This index serves as an important benchmark for portfolios that include exposure to investment grade corporate bonds.
The Bloomberg US Corporate High Yield Index covers performance for United States high yield corporate bonds. This index serves as an important benchmark for portfolios that include exposure to riskier corporate bonds that might not necessarily be investment grade.
Treasuries, also known as Treasury securities, are debt obligations issued by the United States government. They are used to raise cash needed to fund government operations and help finance the federal deficit. Treasuries are backed by the full faith and credit of the US government, making them one of the safest investments. They are an important instrument in monetary policy, allowing central banks to control the money supply.
The Prime Rate is the interest rate that commercial banks charge their most creditworthy corporate customers. The prime rate is derived from the federal funds rate, usually using fed funds + 3 as the formula.