Markets Digest the Path of Interest Rates & the Next Phase of the AI Cycle
Monthly Market Summary
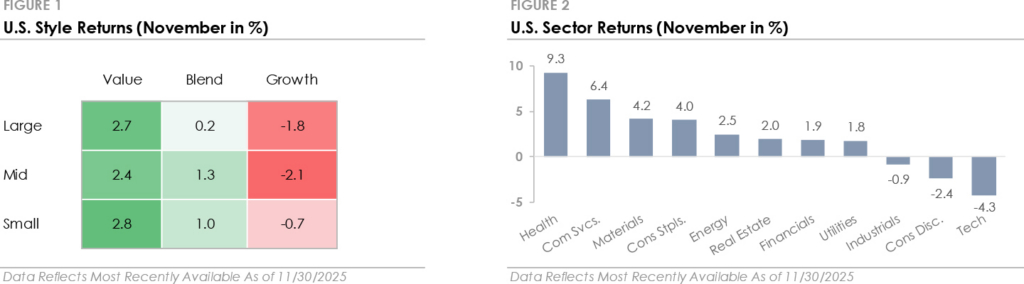
- The S&P 500 Index returned +0.2% in November, its seventh consecutive monthly gain. Large Cap Growth declined -1.8% as AI-related names came under pressure, while Large Cap Value rose +2.7%. The Russell 2000 and the Dow Jones Index both outperformed the S&P 500 as mega-cap tech stocks weighed down the index.
- Health Care led all S&P 500 sectors with a +9.3% return. Eight of the eleven S&P 500 sectors outperformed the index, while the Technology, Consumer Discretionary, and Industrials sectors each traded lower and underperformed the index.
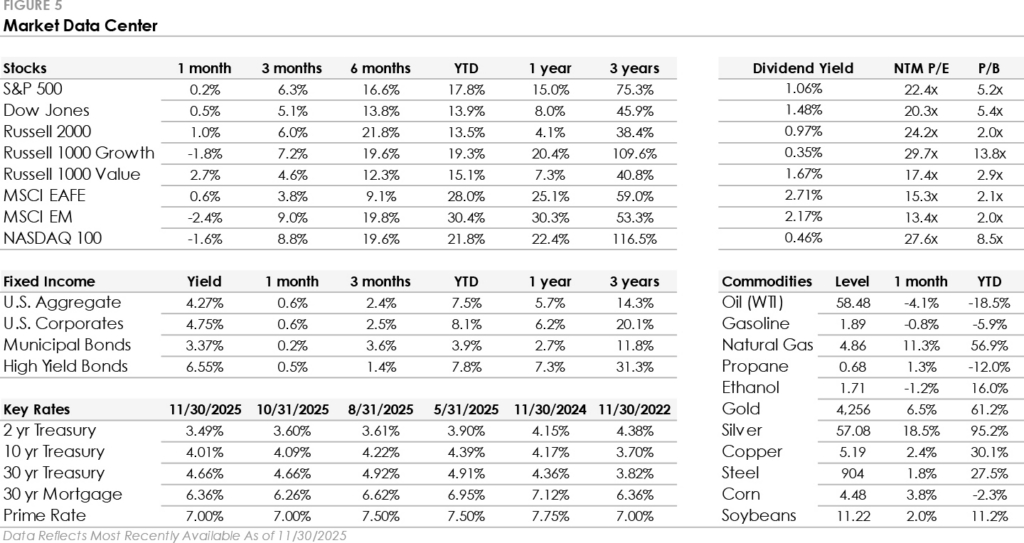
- Bonds traded higher as Treasury yields ended the month lower despite intra-month volatility tied to uncertainty around a December rate cut. The U.S. Bond Aggregate gained +0.6%, increasing its year-to-date return to +7.5%. Investment-grade bonds matched the Aggregate’s +0.6% total return, edging out high-yield’s +0.5% gain.
- International stocks were mixed. Developed Markets gained +0.6%, modestly outperforming the S&P 500, while Emerging Markets fell -2.4%. Year-to-date, both regions are outperforming the S&P 500 by more than +10%.
The Market’s Tug-of-War with the Federal Reserve
The stock market was volatile in November as the Federal Reserve managed investor expectations for a December rate cut. The volatility started after the Fed’s late-October meeting, when Chair Powell said a December rate cut was “not a foregone conclusion”. Market-implied odds for a third consecutive rate cut fell from 98% in late October to around 40% in mid-November, as multiple Fed officials questioned the need for another rate cut. The uncertainty weighed on the stock market, with the S&P 500 trading lower and eventually bottoming on November 20th. Sentiment then shifted again late in the month as comments from influential Fed members, rising unemployment, and favorable inflation data pushed the odds of a December cut back above 80%.
The market’s reaction wasn’t just about a -0.25% rate cut, but rather what the Fed’s decision signaled about the future. A December cut would affirm the bullish narrative that the Fed was pulling off a “soft landing”, whereby the central bank proactively lowers interest rates to reduce the risk of recession. When the odds of a December cut initially fell, the market sold off as investors reassessed that optimistic outlook. Leaving rates unchanged would keep financial conditions tighter for longer, potentially slowing the economy and earnings growth. The late month rebound, fueled by rising expectations of a December cut, reflected increased clarity and confidence about the path ahead.
The AI Trade Moves to the Next Phase as Investors Become More Selective
Artificial intelligence remains a key market driver with 7 of the 10 largest S&P 500 companies, or nearly 30% of the index, tied to the AI industry. In November, there was a noticeable shift in investor sentiment toward AI stocks, moving from broad enthusiasm to increased scrutiny and selectivity. The month began with concerns over the expensive valuations of the Magnificent 7 tech giants, particularly those most reliant on the AI infrastructure buildout. Questions emerged about whether the massive capital spending on data centers and cloud infrastructure will translate into profits strong enough to justify the companies’ high valuations. This skepticism around AI’s economics led to a sell-off across the AI industry, with companies like Nvidia and Amazon down over -10% at times. Given the S&P 500’s extreme concentration in mega-cap technology stocks, the focused weakness was a major factor dragging down the index.
The AI investment cycle is maturing, with investors’ focus shifting from pure infrastructure spending to real-world application and monetization. Signs of AI fatigue have emerged as investors weigh the steep upfront costs against uncertain long-term economics and productivity gains. One example is Oracle, which has fallen nearly -40% since September due to concerns about its aggressive debt-funded data center expansion, highlights the growing cost anxiety. While AI remains a central theme in most 2026 market outlooks, investors are becoming more selective toward AI stocks, looking for tangible evidence of revenue growth and productivity improvements across the broader economy.
This Month in Numbers
Important Disclosures
Published by Market Desk Research and distributed by QuadCap Wealth Management, LLC.
This client letter is being furnished by QuadCap Wealth Management, LLC (“QuadCap”) on a confidential basis for the exclusive use of clients of QuadCap. and may not be disseminated, communicated, reproduced, redistributed or otherwise disclosed by the recipient to any other person without the prior written consent of QuadCap.
This document does not constitute an offer, solicitation or recommendation to sell or an offer to buy any securities, investment products or investment advisory services. Such an offer may only be made to prospective investors by means of delivery of an investment advisory agreement, subscription agreement and other similar materials that contain a description of the material terms relating to such investment, investment strategy or service. This presentation is being provided for general informational purposes only.
This presentation includes information based on data found in independent industry publications and other sources and is current as of the date of this presentation. Although we believe that the data are reliable, we have not sought, nor have we received, permission from any third-party to include their information in this presentation. Charts, tables and graphs contained in this document are not intended to be used to assist the reader in determining which securities to buy or sell or when to buy or sell securities. Opinions, estimates, and projections constitute the current judgment of QuadCap and are subject to change without notice.
References to any indices are for informational and general comparative purposes only. There are significant differences between such indices and the investment programs described in this presentation. References to indices do not suggest that the investment programs will, or are likely to, achieve returns, volatility, or other results similar to such indices. The performance data of various indices presented herein was current as of the date of the presentation.
Past performance is not indicative of future results and there can be no assurance that the future performance of any specific investment or investment strategy will be profitable or equal any corresponding index or benchmark. The performance information shown herein is based on total returns with dividends reinvested and does not reflect the deduction of advisory and/or other fees normally incurred in the management of a portfolio. Stock performance and fundamental data is based on the following instruments: SPDR S&P 500 ETF (SPY), SPDR Dow Jones ETF (DIA), iShares Russell 2000 ETF (IWM), iShares Russell 1000 Growth ETF (IWF), iShares Russell 1000 Value ETF (IWD), iShares MSCI EAFE ETF (EFA), iShares MSCI Emerging Markets ETF (EEM), Invesco QQQ Trust (QQQ). Fixed Income performance is based on the following instruments: iShares Core U.S. Aggregate Bond ETF (AGG), iShares Investment Grade Corporate ETF (LQD), iShares National Muni Bond ETF (MUB), iShares High Yield Corporate ETF (HYG). Fixed Income yields and key rates are based on the following instruments: Bloomberg US Aggregate, ICE BofA US Corporate, ICE BofA US Municipal Securities, ICE BofA US High Yield, 2 Year US Benchmark Bond, 10 Year US Benchmark Bond, 30 Year US Benchmark Bond, 30 Year US Fixed Mortgage Rate, US Prime Rate. Commodity prices are based on the following instruments: Crude Oil WTI (NYM $/bbl), Gasoline Regular U.S. Gulf Coast ($/gal), Natural Gas (NYM $/mmbtu), Propane (NYM $/gal), Ethanol (CRB $/gallon), Gold (NYM $/ozt), Silver (NYM $/ozt), Copper NYMEX ($/lb), U.S. Midwest Domestic Hot-Rolled Coil Steel (NYM $/st), Corn (CBT $/bu), Soybeans (Chicago $/bu). U.S. Style performance is based on the following instruments: iShares Russell 1000 Value ETF (IWD), SPDR S&P 500 ETF Trust (SPY), iShares Russell 1000 Growth ETF (IWF), iShares Russell Mid-Cap Value ETF (IWS), iShares Russell Midcap ETF (IWR), iShares Russell Mid-Cap Growth ETF (IWP), iShares Russell 2000 Value ETF (IWN), iShares Russell 2000 ETF (IWM), iShares Russell 2000 Growth ETF (IWO). U.S. Sector performance is based on the following instruments: Consumer Discretionary Sector SPDR ETF (XLY), Consumer Staples Sector SPDR ETF (XLP), Energy Sector SPDR ETF (XLE), Financial Sector SPDR ETF (XLF), Health Care Sector SPDR ETF (XLV), Industrial Sector SPDR ETF (XLI), Materials Sector SPDR ETF (XLB), Technology Sector SPDR ETF (XLK), Communication Services Sector SPDR ETF (XLC), Utilities Sector SPDR ETF (XLU), Real Estate Sector SPDR ETF (XLRE).
Advisory Services are offered through QuadCap, an SEC registered investment advisor. QuadCap only transacts business in states where it is properly registered or is excluded or exempted from registration requirements. SEC registration is not an endorsement of the firm by the Commission and does not mean that QuadCap has attained a specific level of skill or ability.
The S&P 500 Index or Standard & Poor’s 500 Index is a market-capitalization-weighted index of 500 leading publicly traded companies in the U.S.
The Russell 2000 index measures the performance of approximately 2,000 small-cap US equities.
The MSCI EAFE Index is a stock market index that measures the performance of large- and mid-cap companies across 21 developed markets countries around the world. Canada and the USA are not included.
The MSCI Emerging Markets Index captures large and mid cap representation across 24 Emerging Markets (EM) countries.
The Nasdaq 100 Index is a stock index of the 100 largest companies by modified market capitalization trading on Nasdaq exchanges.
The Russell 1000 Growth index is an index that tracks large cap, growth stocks. This benchmark is important for investors that might tilt their investments towards large cap growth. Growth stocks, in comparison to value stocks, are considered companies with a more growth potential, and a higher risk profile.
The Russell 1000 Value index is an index that tracks large cap, value stocks. This benchmark is important for investors that might tilt their investments towards large cap value. Value stocks, in comparison to growth stocks, are considered companies with a stable cash flow, and more mature business model.
The Dow Jones Industrial Average, or simply the Dow, is a stock market index that indicates the value of 30 large, publicly owned companies based in the United States, and how they have traded in the stock market during various periods of time. These 30 companies are also included in the S&P 500 Index. The value of the Dow is not a weighted arithmetic mean and does not represent its component companies’ market capitalization, but rather the sum of the price of one share of stock for each component company. The sum is corrected by a factor which changes whenever one of the component stocks has a stock split or stock dividend, so as to generate a consistent value for the index.
The Bloomberg US Aggregate Bond Index is used as a benchmark for investment grade bonds within the United States. This index is important as a benchmark for someone wanting to track their fixed income asset allocation.
The Bloomberg US Corporate Index covers performance for United States corporate bonds. This index serves as an important benchmark for portfolios that include exposure to investment grade corporate bonds.
The Bloomberg US Corporate High Yield Index covers performance for United States high yield corporate bonds. This index serves as an important benchmark for portfolios that include exposure to riskier corporate bonds that might not necessarily be investment grade.
Treasuries, also known as Treasury securities, are debt obligations issued by the United States government. They are used to raise cash needed to fund government operations and help finance the federal deficit. Treasuries are backed by the full faith and credit of the US government, making them one of the safest investments. They are an important instrument in monetary policy, allowing central banks to control the money supply.
The Prime Rate is the interest rate that commercial banks charge their most creditworthy corporate customers. The prime rate is derived from the federal funds rate, usually using fed funds + 3 as the formula.