Stocks Hit New Highs as Market Navigates Shutdown, Fed Policy, & AI Spending
Monthly Market Summary
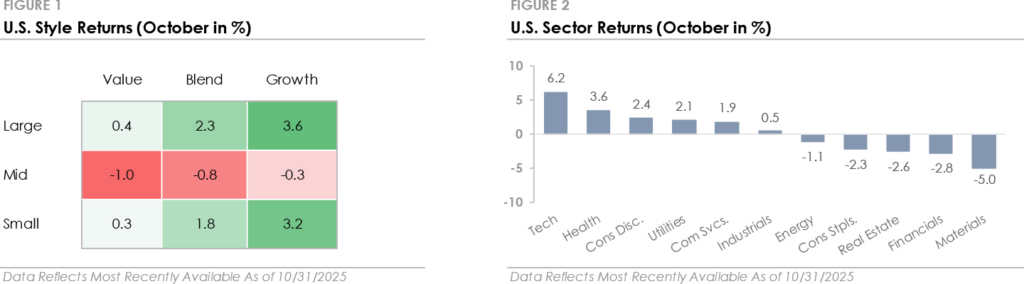
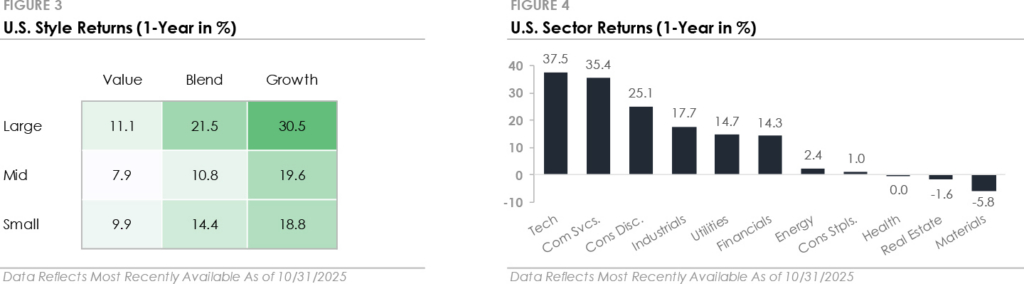
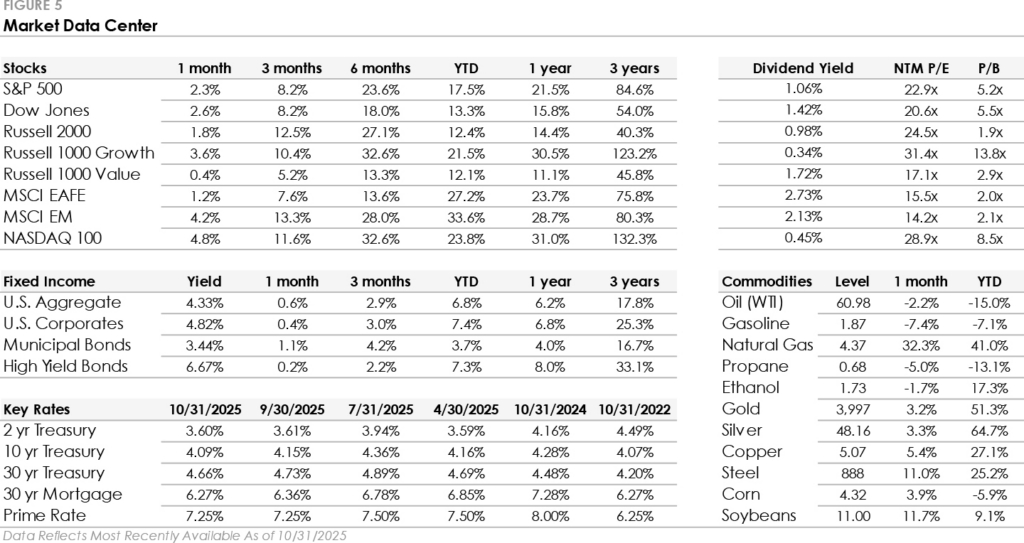
- The S&P 500 Index rose +2.3% in October, bringing its year-to-date return to +17.5%. Large Cap Growth stocks gained +3.6% and outperformed the index, while Large Cap Value returned +0.4%. Major stock indices set new highs, with the S&P 500, Dow Jones, Nasdaq 100, and Russell 2000 all posting a sixth straight month of gains.
- Technology led all S&P 500 sectors, with the Nasdaq 100 gaining +4.8%. Health Care and Consumer Discretionary also outperformed the index, while the remaining eight sectors underperformed, with five sectors trading lower.
- Bonds traded higher as Treasury yields ended lower despite intra-month volatility. The U.S. Bond Aggregate returned +0.6%, while corporate bonds underperformed. Investment-grade delivered a +0.4% total return, and high-yield gained +0.2%.
- International stocks split the S&P 500’s return. Developed Markets gained +1.2%, underperforming the S&P 500, while Emerging Markets returned +4.2%.
Federal Reserve Cuts Interest Rates as Government Shutdown Drags On
The government shutdown that began October 1st remains unresolved as of month-end, officially becoming the second-longest in U.S. history behind 2018. The shutdown, which is due to partisan gridlock over federal spending and health care subsidies, has disrupted government operations and caused hardship for federal workers. The market has mostly dismissed the stalemate as political noise, but the length of the shutdown is starting to raise concerns about its impact on consumer sentiment and business activity.
The shutdown has complicated interest rate policy by halting the release of economic data. Federal Reserve policymakers have had to make decisions without the latest data on the labor market, consumer spending, and housing market. Despite the data blackout, the Fed cut rates by -0.25% in October, its second consecutive rate cut. The decision reflects growing concern over labor market softening, with Chair Powell emphasizing that employment risks have overtaken inflation concerns, despite inflation still above the 2% target. The market expects another 0.25% rate cut in December, although the probability fell after Powell said a rate cut is “not a foregone conclusion”.
Stocks Trade Near All-Time Highs Despite Credit Concerns & Trade Tensions
Stocks ended October near all-time highs after they staged a late-month recovery. Credit concerns surfaced early in the month after multiple regional banks disclosed losses tied to commercial real estate fraud. The news came only weeks after two high-profile bankruptcies in the auto sector and reignited concerns about credit quality. Stocks initially sold off, but by month-end, concerns eased as credit rating agencies and analysts characterized the issues as isolated rather than systemic.
Around the same time, a sudden re-escalation of U.S.–China trade tensions rattled the market just weeks before a high-stakes Trump-Xi summit. It began when China expanded export restrictions on rare earth minerals, prompting the White House to threaten a 100% tariff on all Chinese imports if Beijing didn’t reverse course. The threats sparked a stock market sell-off and revived fears of a trade war. However, despite the harsh rhetoric and threats, both sides left room for negotiation. The Trump-Xi summit took place as scheduled in late October, and the meeting yielded several headline agreements that helped ease near-term U.S.-China trade tensions.
Market Sentiment: Cautious Optimism Ahead of Year-End
Market sentiment is cautiously optimistic heading into the final two months of the year, supported by the Fed’s rate-cutting cycle, continued enthusiasm around AI, and solid Q3 corporate earnings. November and December are historically strong for equities, and while investors are bullish, they’re not euphoric. Despite credit concerns fading and trade tensions easing, other risks remain. Valuations are elevated, investors are questioning the return from AI infrastructure spending, and job growth has slowed in recent months. Chair Powell’s pushback against a December rate cut tempered some enthusiasm, but hopes for a year-end market rally remain intact, even as attention shifts to 2026.
This Month in Numbers
Important Disclosures
Published by Market Desk Research and distributed by QuadCap Wealth Management, LLC.
This client letter is being furnished by QuadCap Wealth Management, LLC (“QuadCap”) on a confidential basis for the exclusive use of clients of QuadCap. and may not be disseminated, communicated, reproduced, redistributed or otherwise disclosed by the recipient to any other person without the prior written consent of QuadCap.
This document does not constitute an offer, solicitation or recommendation to sell or an offer to buy any securities, investment products or investment advisory services. Such an offer may only be made to prospective investors by means of delivery of an investment advisory agreement, subscription agreement and other similar materials that contain a description of the material terms relating to such investment, investment strategy or service. This presentation is being provided for general informational purposes only.
This presentation includes information based on data found in independent industry publications and other sources and is current as of the date of this presentation. Although we believe that the data are reliable, we have not sought, nor have we received, permission from any third-party to include their information in this presentation. Charts, tables and graphs contained in this document are not intended to be used to assist the reader in determining which securities to buy or sell or when to buy or sell securities. Opinions, estimates, and projections constitute the current judgment of QuadCap and are subject to change without notice.
References to any indices are for informational and general comparative purposes only. There are significant differences between such indices and the investment programs described in this presentation. References to indices do not suggest that the investment programs will, or are likely to, achieve returns, volatility, or other results similar to such indices. The performance data of various indices presented herein was current as of the date of the presentation.
Past performance is not indicative of future results and there can be no assurance that the future performance of any specific investment or investment strategy will be profitable or equal any corresponding index or benchmark. The performance information shown herein is based on total returns with dividends reinvested and does not reflect the deduction of advisory and/or other fees normally incurred in the management of a portfolio. Stock performance and fundamental data is based on the following instruments: SPDR S&P 500 ETF (SPY), SPDR Dow Jones ETF (DIA), iShares Russell 2000 ETF (IWM), iShares Russell 1000 Growth ETF (IWF), iShares Russell 1000 Value ETF (IWD), iShares MSCI EAFE ETF (EFA), iShares MSCI Emerging Markets ETF (EEM), Invesco QQQ Trust (QQQ). Fixed Income performance is based on the following instruments: iShares Core U.S. Aggregate Bond ETF (AGG), iShares Investment Grade Corporate ETF (LQD), iShares National Muni Bond ETF (MUB), iShares High Yield Corporate ETF (HYG). Fixed Income yields and key rates are based on the following instruments: Bloomberg US Aggregate, ICE BofA US Corporate, ICE BofA US Municipal Securities, ICE BofA US High Yield, 2 Year US Benchmark Bond, 10 Year US Benchmark Bond, 30 Year US Benchmark Bond, 30 Year US Fixed Mortgage Rate, US Prime Rate. Commodity prices are based on the following instruments: Crude Oil WTI (NYM $/bbl), Gasoline Regular U.S. Gulf Coast ($/gal), Natural Gas (NYM $/mmbtu), Propane (NYM $/gal), Ethanol (CRB $/gallon), Gold (NYM $/ozt), Silver (NYM $/ozt), Copper NYMEX ($/lb), U.S. Midwest Domestic Hot-Rolled Coil Steel (NYM $/st), Corn (CBT $/bu), Soybeans (Chicago $/bu). U.S. Style performance is based on the following instruments: iShares Russell 1000 Value ETF (IWD), SPDR S&P 500 ETF Trust (SPY), iShares Russell 1000 Growth ETF (IWF), iShares Russell Mid-Cap Value ETF (IWS), iShares Russell Midcap ETF (IWR), iShares Russell Mid-Cap Growth ETF (IWP), iShares Russell 2000 Value ETF (IWN), iShares Russell 2000 ETF (IWM), iShares Russell 2000 Growth ETF (IWO). U.S. Sector performance is based on the following instruments: Consumer Discretionary Sector SPDR ETF (XLY), Consumer Staples Sector SPDR ETF (XLP), Energy Sector SPDR ETF (XLE), Financial Sector SPDR ETF (XLF), Health Care Sector SPDR ETF (XLV), Industrial Sector SPDR ETF (XLI), Materials Sector SPDR ETF (XLB), Technology Sector SPDR ETF (XLK), Communication Services Sector SPDR ETF (XLC), Utilities Sector SPDR ETF (XLU), Real Estate Sector SPDR ETF (XLRE).
Advisory Services are offered through QuadCap, an SEC registered investment advisor. QuadCap only transacts business in states where it is properly registered or is excluded or exempted from registration requirements. SEC registration is not an endorsement of the firm by the Commission and does not mean that QuadCap has attained a specific level of skill or ability.
The S&P 500 Index or Standard & Poor’s 500 Index is a market-capitalization-weighted index of 500 leading publicly traded companies in the U.S.
The Russell 2000 index measures the performance of approximately 2,000 small-cap US equities.
The MSCI EAFE Index is a stock market index that measures the performance of large- and mid-cap companies across 21 developed markets countries around the world. Canada and the USA are not included.
The MSCI Emerging Markets Index captures large and mid cap representation across 24 Emerging Markets (EM) countries.
The Nasdaq 100 Index is a stock index of the 100 largest companies by modified market capitalization trading on Nasdaq exchanges.
The Russell 1000 Growth index is an index that tracks large cap, growth stocks. This benchmark is important for investors that might tilt their investments towards large cap growth. Growth stocks, in comparison to value stocks, are considered companies with a more growth potential, and a higher risk profile.
The Russell 1000 Value index is an index that tracks large cap, value stocks. This benchmark is important for investors that might tilt their investments towards large cap value. Value stocks, in comparison to growth stocks, are considered companies with a stable cash flow, and more mature business model.
The Dow Jones Industrial Average, or simply the Dow, is a stock market index that indicates the value of 30 large, publicly owned companies based in the United States, and how they have traded in the stock market during various periods of time. These 30 companies are also included in the S&P 500 Index. The value of the Dow is not a weighted arithmetic mean and does not represent its component companies’ market capitalization, but rather the sum of the price of one share of stock for each component company. The sum is corrected by a factor which changes whenever one of the component stocks has a stock split or stock dividend, so as to generate a consistent value for the index.
The Bloomberg US Aggregate Bond Index is used as a benchmark for investment grade bonds within the United States. This index is important as a benchmark for someone wanting to track their fixed income asset allocation.
The Bloomberg US Corporate Index covers performance for United States corporate bonds. This index serves as an important benchmark for portfolios that include exposure to investment grade corporate bonds.
The Bloomberg US Corporate High Yield Index covers performance for United States high yield corporate bonds. This index serves as an important benchmark for portfolios that include exposure to riskier corporate bonds that might not necessarily be investment grade.
Treasuries, also known as Treasury securities, are debt obligations issued by the United States government. They are used to raise cash needed to fund government operations and help finance the federal deficit. Treasuries are backed by the full faith and credit of the US government, making them one of the safest investments. They are an important instrument in monetary policy, allowing central banks to control the money supply.
The Prime Rate is the interest rate that commercial banks charge their most creditworthy corporate customers. The prime rate is derived from the federal funds rate, usually using fed funds + 3 as the formula.