Lessons from the ’90s: How AI Is Powering a New Investment Cycle
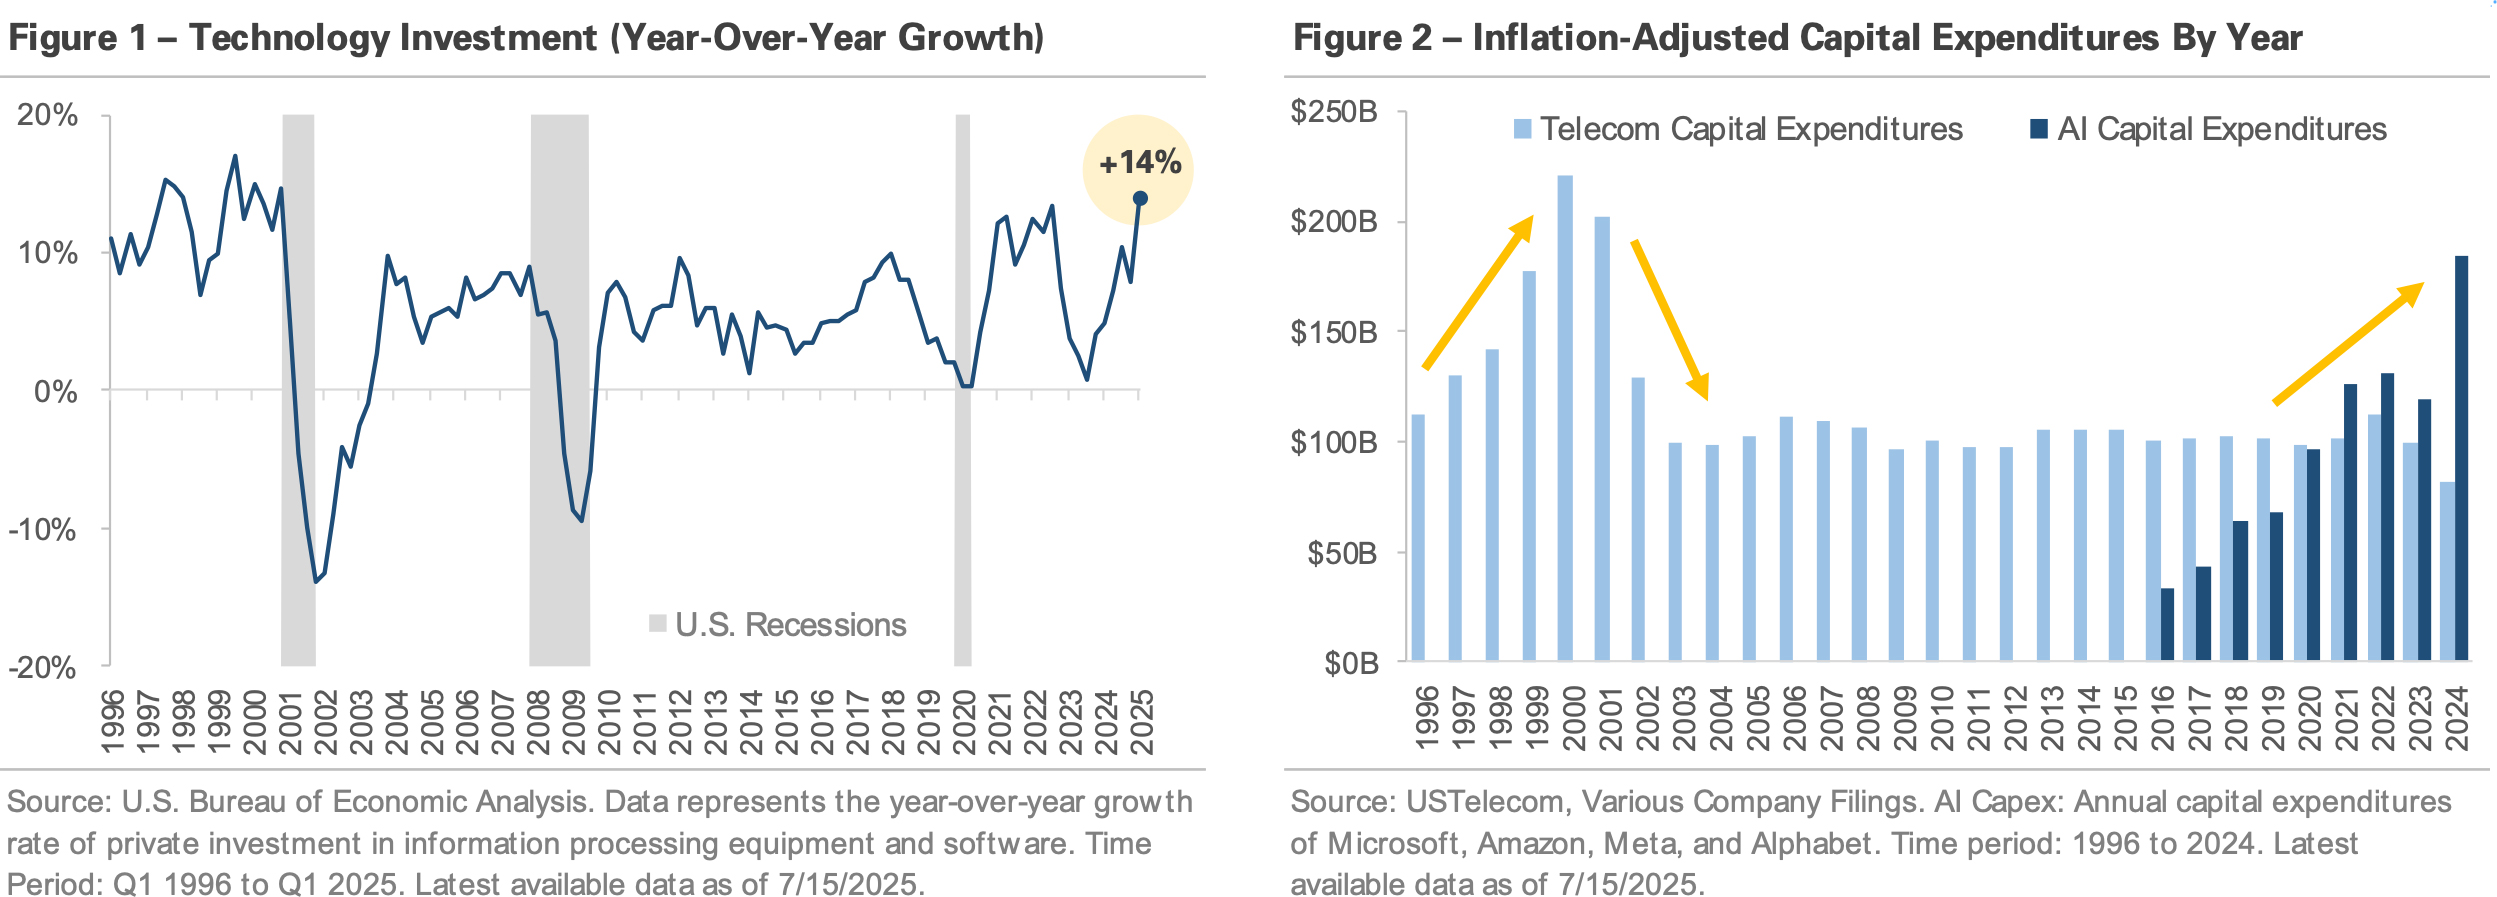
Technology spending is accelerating at the fastest pace in decades. Figure 1 shows investment in information processing equipment and software grew +14% year-over-year (YoY) in Q1 2025, the fastest pace since the late 1990s. During the dot-com era, investment in computers and software grew over +15% YoY before collapsing in the early 2000s as the tech bubble burst. Tech investment rebounded in the mid-2000s but turned negative again in 2008 as economic growth slowed. Spending growth averaged a more modest +5.5% YoY in the 2010s, but it remained well below the highs of the late 90s. The COVID pandemic initially caused tech spending to stall, but it reaccelerated in recent years and is now growing at 1990s levels.
Figure 2 graphs annual capital expenditures by telecom and artificial intelligence (AI) companies, adjusted for inflation. The data reveals two distinct eras of rapid technology investment. At the turn of the century the world was transitioning to a more digital society. In the late 1990s, telecom companies invested heavily to lay fiber, construct cell towers, and build the internet’s physical backbone. Telecom investment slowed in the early 2000s before stabilizing over the past two decades. Today, a new wave of tech investment is underway, driven by advancements in AI. Leading tech companies are investing billions in computer chips to train AI models, data centers to run the models, and new energy infrastructure to support it all. The chart shows AI capex could soon surpass the telecom peak from the late 1990s.
The latest tech spending boom has significantly impacted the stock market. Over the past two years, the S&P 500 technology sector gained +66%, outpacing the S&P 500’s +42% return. The “Magnificent 7,” a group of mega-cap AI leaders that includes Nvidia, Microsoft, Amazon, and Meta, returned +89% over the same period, more than double the S&P 500’s price return. The group’s large index weight and its ability to convert the AI industry’s momentum into earnings growth have driven the stock market to a series of record highs.
This period is a historical moment, marked by billions being spent to develop a transformative technology. Two takeaways come to mind when reviewing the figures below. First, as the late 1990s telecom boom showed, today’s rapid growth will eventually return to a more normal level. The current growth rate is unlikely to continue indefinitely, and Figure 1 shows tech investment has historically been tied to overall economic growth. Second, today’s spending levels are a reminder that the U.S. economy has a strong track record of innovation and economic resilience. Investing in the stock market offers a way to participate in and benefit from those advancements.
Important Disclosures
Published by Market Desk Research and distributed by QuadCap Wealth Management, LLC.
This client letter is being furnished by QuadCap Wealth Management, LLC (“QuadCap”) on a confidential basis for the exclusive use of clients of QuadCap. and may not be disseminated, communicated, reproduced, redistributed or otherwise disclosed by the recipient to any other person without the prior written consent of QuadCap.
This document does not constitute an offer, solicitation or recommendation to sell or an offer to buy any securities, investment products or investment advisory services. Such an offer may only be made to prospective investors by means of delivery of an investment advisory agreement, subscription agreement and other similar materials that contain a description of the material terms relating to such investment, investment strategy or service. This presentation is being provided for general informational purposes only.
This presentation includes information based on data found in independent industry publications and other sources and is current as of the date of this presentation. Although we believe that the data are reliable, we have not sought, nor have we received, permission from any third-party to include their information in this presentation. Charts, tables and graphs contained in this document are not intended to be used to assist the reader in determining which securities to buy or sell or when to buy or sell securities. Opinions, estimates, and projections constitute the current judgment of QuadCap and are subject to change without notice.
References to any indices are for informational and general comparative purposes only. There are significant differences between such indices and the investment programs described in this presentation. References to indices do not suggest that the investment programs will, or are likely to, achieve returns, volatility, or other results similar to such indices. The performance data of various indices presented herein was current as of the date of the presentation.
Past performance is not indicative of future results and there can be no assurance that the future performance of any specific investment or investment strategy will be profitable or equal any corresponding index or benchmark. The performance information shown herein is based on total returns with dividends reinvested and does not reflect the deduction of advisory and/or other fees normally incurred in the management of a portfolio.
Advisory Services are offered through QuadCap, an SEC registered investment advisor. QuadCap only transacts business in states where it is properly registered or is excluded or exempted from registration requirements. SEC registration is not an endorsement of the firm by the Commission and does not mean that QuadCap has attained a specific level of skill or ability.
The S&P 500 Index or Standard & Poor’s 500 Index is a market-capitalization-weighted index of 500 leading publicly traded companies in the U.S.
The Russell 2000 index measures the performance of approximately 2,000 small-cap US equities.
The MSCI EAFE Index is a stock market index that measures the performance of large- and mid-cap companies across 21 developed markets countries around the world. Canada and the USA are not included.
The MSCI Emerging Markets Index captures large and mid cap representation across 24 Emerging Markets (EM) countries.
The Nasdaq 100 Index is a stock index of the 100 largest companies by modified market capitalization trading on Nasdaq exchanges.
The Russell 1000 Growth index is an index that tracks large cap, growth stocks. This benchmark is important for investors that might tilt their investments towards large cap growth. Growth stocks, in comparison to value stocks, are considered companies with a more growth potential, and a higher risk profile.
The Russell 1000 Value index is an index that tracks large cap, value stocks. This benchmark is important for investors that might tilt their investments towards large cap value. Value stocks, in comparison to growth stocks, are considered companies with a stable cash flow, and more mature business model.
The Dow Jones Industrial Average, or simply the Dow, is a stock market index that indicates the value of 30 large, publicly owned companies based in the United States, and how they have traded in the stock market during various periods of time. These 30 companies are also included in the S&P 500 Index. The value of the Dow is not a weighted arithmetic mean and does not represent its component companies’ market capitalization, but rather the sum of the price of one share of stock for each component company. The sum is corrected by a factor which changes whenever one of the component stocks has a stock split or stock dividend, so as to generate a consistent value for the index.
The Bloomberg US Aggregate Bond Index is used as a benchmark for investment grade bonds within the United States. This index is important as a benchmark for someone wanting to track their fixed income asset allocation.
The Bloomberg US Corporate Index covers performance for United States corporate bonds. This index serves as an important benchmark for portfolios that include exposure to investment grade corporate bonds.
The Bloomberg US Corporate High Yield Index covers performance for United States high yield corporate bonds. This index serves as an important benchmark for portfolios that include exposure to riskier corporate bonds that might not necessarily be investment grade.
Treasuries, also known as Treasury securities, are debt obligations issued by the United States government. They are used to raise cash needed to fund government operations and help finance the federal deficit. Treasuries are backed by the full faith and credit of the US government, making them one of the safest investments. They are an important instrument in monetary policy, allowing central banks to control the money supply.
The Prime Rate is the interest rate that commercial banks charge their most creditworthy corporate customers. The prime rate is derived from the federal funds rate, usually using fed funds + 3 as the formula.