Corporate Earnings Off to a Solid Start in 2025
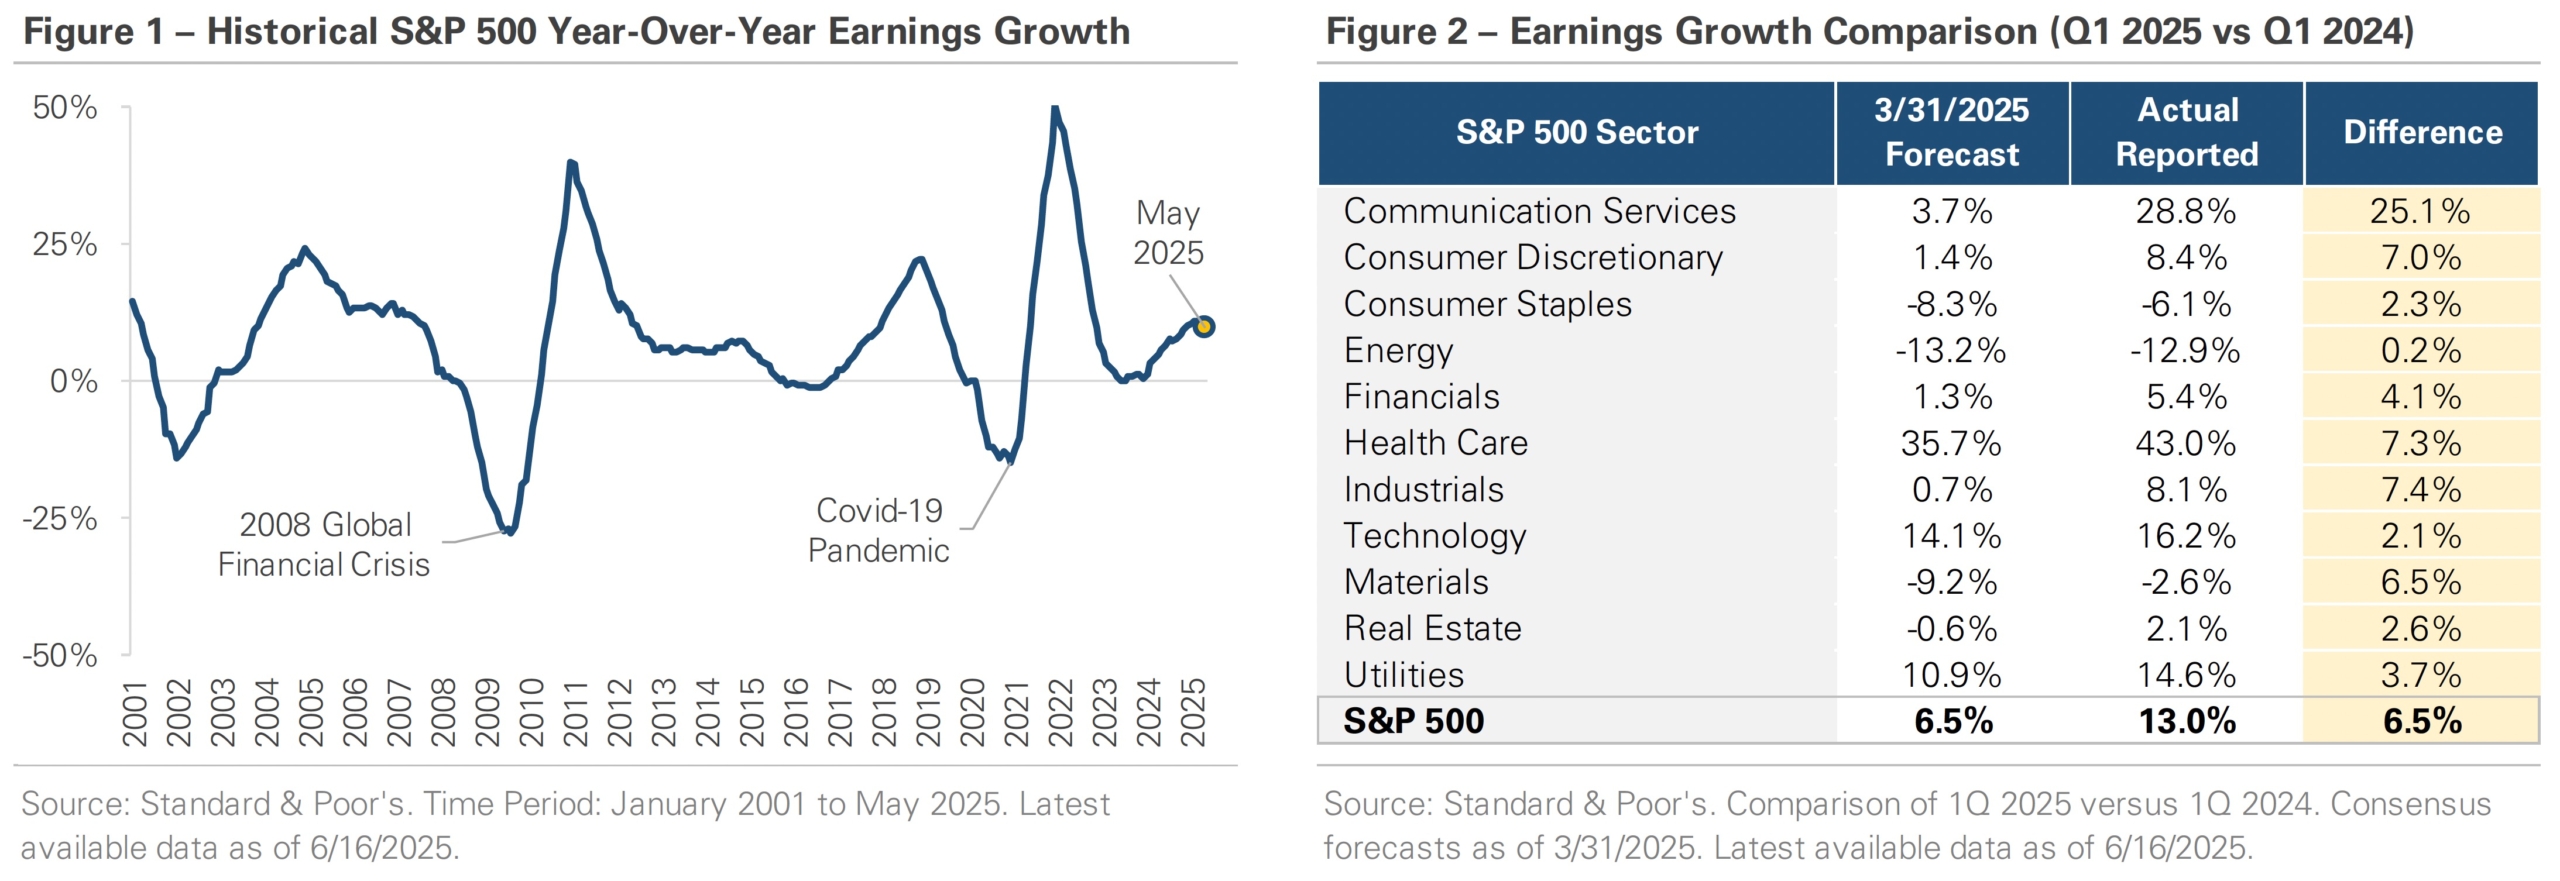
The stock market’s performance is a function of two variables: earnings and valuations. A company generates profits, and investors assign a multiple to those profits, such as 15x or 20x earnings, to determine the company’s valuation. This year, earnings have been in the spotlight as policy uncertainty around tariffs and global trade clouds the outlook. With Q2 earnings season starting in mid-July, it’s a good time to see how companies performed in Q1. While businesses and economists warned about rising input costs, disrupted supply chains, and slower economic growth, actual Q1 results suggest the impact was limited. Figure 1 graphs the S&P 500’s trailing 12-month earnings growth from 2001 through May 2025, which is calculated as the index’s earnings over the last 12 months divided by earnings from the prior 12 months. It shows S&P 500 earnings grew by +10% in Q1, with corporate America continuing to deliver solid results.
The table in Figure 2 compares Q1 2025 earnings for each S&P 500 sector against Q1 2024 results. Year-over-year comparisons strip out the impact of seasonal effects, such as winter weather and holiday spending, and provide a clearer view of underlying trends. The first column shows Wall Street’s forecasted earnings growth as of March 31st, the second column shows reported results, and the third column shows the difference. The bottom line shows S&P 500 earnings grew +13% compared to the same quarter a year ago, exceeding expectations by nearly +6%.
Looking further up the table, the data shows every S&P 500 sector reported actual results that beat the estimate at the end of Q1. Much of the S&P 500’s earnings strength came from large technology firms, particularly those involved in artificial intelligence, which continue to benefit from strong demand. However, the positive surprises weren’t limited to the technology sector, with the industrials, health care, financials, and materials sectors also beating expectations. The strong performance across sectors highlights the resilience of corporate profits in Q1 despite policy uncertainty and concerns about slowing economic growth.
The outlook for the rest of 2025 is unclear. While tariff pauses and de-escalation have eased near-term pressure, many companies remain cautious due to unresolved policy risks tied to global trade. Earnings guidance has been more conservative, with management teams flagging rising input costs and reduced visibility into future demand. It’s also important to note that Q1 earnings results reflect activity from January through March, before widespread tariffs were announced in early April. Those increased tariffs could have a delayed impact on input costs and profit margins later this year. In summary, Q1 was a solid start, but future earnings will depend on companies’ ability to navigate a complex economic and policy environment.
Important Disclosures
Published by Market Desk Research and distributed by QuadCap Wealth Management, LLC.
This client letter is being furnished by QuadCap Wealth Management, LLC (“QuadCap”) on a confidential basis for the exclusive use of clients of QuadCap. and may not be disseminated, communicated, reproduced, redistributed or otherwise disclosed by the recipient to any other person without the prior written consent of QuadCap.
This document does not constitute an offer, solicitation or recommendation to sell or an offer to buy any securities, investment products or investment advisory services. Such an offer may only be made to prospective investors by means of delivery of an investment advisory agreement, subscription agreement and other similar materials that contain a description of the material terms relating to such investment, investment strategy or service. This presentation is being provided for general informational purposes only.
This presentation includes information based on data found in independent industry publications and other sources and is current as of the date of this presentation. Although we believe that the data are reliable, we have not sought, nor have we received, permission from any third-party to include their information in this presentation. Charts, tables and graphs contained in this document are not intended to be used to assist the reader in determining which securities to buy or sell or when to buy or sell securities. Opinions, estimates, and projections constitute the current judgment of QuadCap and are subject to change without notice.
References to any indices are for informational and general comparative purposes only. There are significant differences between such indices and the investment programs described in this presentation. References to indices do not suggest that the investment programs will, or are likely to, achieve returns, volatility, or other results similar to such indices. The performance data of various indices presented herein was current as of the date of the presentation.
Past performance is not indicative of future results and there can be no assurance that the future performance of any specific investment or investment strategy will be profitable or equal any corresponding index or benchmark. The performance information shown herein is based on total returns with dividends reinvested and does not reflect the deduction of advisory and/or other fees normally incurred in the management of a portfolio.
Advisory Services are offered through QuadCap, an SEC registered investment advisor. QuadCap only transacts business in states where it is properly registered or is excluded or exempted from registration requirements. SEC registration is not an endorsement of the firm by the Commission and does not mean that QuadCap has attained a specific level of skill or ability.
The S&P 500 Index or Standard & Poor’s 500 Index is a market-capitalization-weighted index of 500 leading publicly traded companies in the U.S.
The Russell 2000 index measures the performance of approximately 2,000 small-cap US equities.
The MSCI EAFE Index is a stock market index that measures the performance of large- and mid-cap companies across 21 developed markets countries around the world. Canada and the USA are not included.
The MSCI Emerging Markets Index captures large and mid cap representation across 24 Emerging Markets (EM) countries.
The Nasdaq 100 Index is a stock index of the 100 largest companies by modified market capitalization trading on Nasdaq exchanges.
The Russell 1000 Growth index is an index that tracks large cap, growth stocks. This benchmark is important for investors that might tilt their investments towards large cap growth. Growth stocks, in comparison to value stocks, are considered companies with a more growth potential, and a higher risk profile.
The Russell 1000 Value index is an index that tracks large cap, value stocks. This benchmark is important for investors that might tilt their investments towards large cap value. Value stocks, in comparison to growth stocks, are considered companies with a stable cash flow, and more mature business model.
The Dow Jones Industrial Average, or simply the Dow, is a stock market index that indicates the value of 30 large, publicly owned companies based in the United States, and how they have traded in the stock market during various periods of time. These 30 companies are also included in the S&P 500 Index. The value of the Dow is not a weighted arithmetic mean and does not represent its component companies’ market capitalization, but rather the sum of the price of one share of stock for each component company. The sum is corrected by a factor which changes whenever one of the component stocks has a stock split or stock dividend, so as to generate a consistent value for the index.
The Bloomberg US Aggregate Bond Index is used as a benchmark for investment grade bonds within the United States. This index is important as a benchmark for someone wanting to track their fixed income asset allocation.
The Bloomberg US Corporate Index covers performance for United States corporate bonds. This index serves as an important benchmark for portfolios that include exposure to investment grade corporate bonds.
The Bloomberg US Corporate High Yield Index covers performance for United States high yield corporate bonds. This index serves as an important benchmark for portfolios that include exposure to riskier corporate bonds that might not necessarily be investment grade.
Treasuries, also known as Treasury securities, are debt obligations issued by the United States government. They are used to raise cash needed to fund government operations and help finance the federal deficit. Treasuries are backed by the full faith and credit of the US government, making them one of the safest investments. They are an important instrument in monetary policy, allowing central banks to control the money supply.
The Prime Rate is the interest rate that commercial banks charge their most creditworthy corporate customers. The prime rate is derived from the federal funds rate, usually using fed funds + 3 as the formula.