Understanding the Difference Between Soft and Hard Economic Data
Soft and hard economic data are back in the news as trade policy changes. Soft data, such as surveys, measures sentiment, expectations, intentions, and how respondents feel about the economy. In contrast, hard data measures actual results and activity, such as production, spending, and job growth. While they typically move together, there are periods of heightened uncertainty where they can diverge, such as today. This month’s chart focuses on the difference between soft and hard economic data and discusses how to interpret their recent divergence.
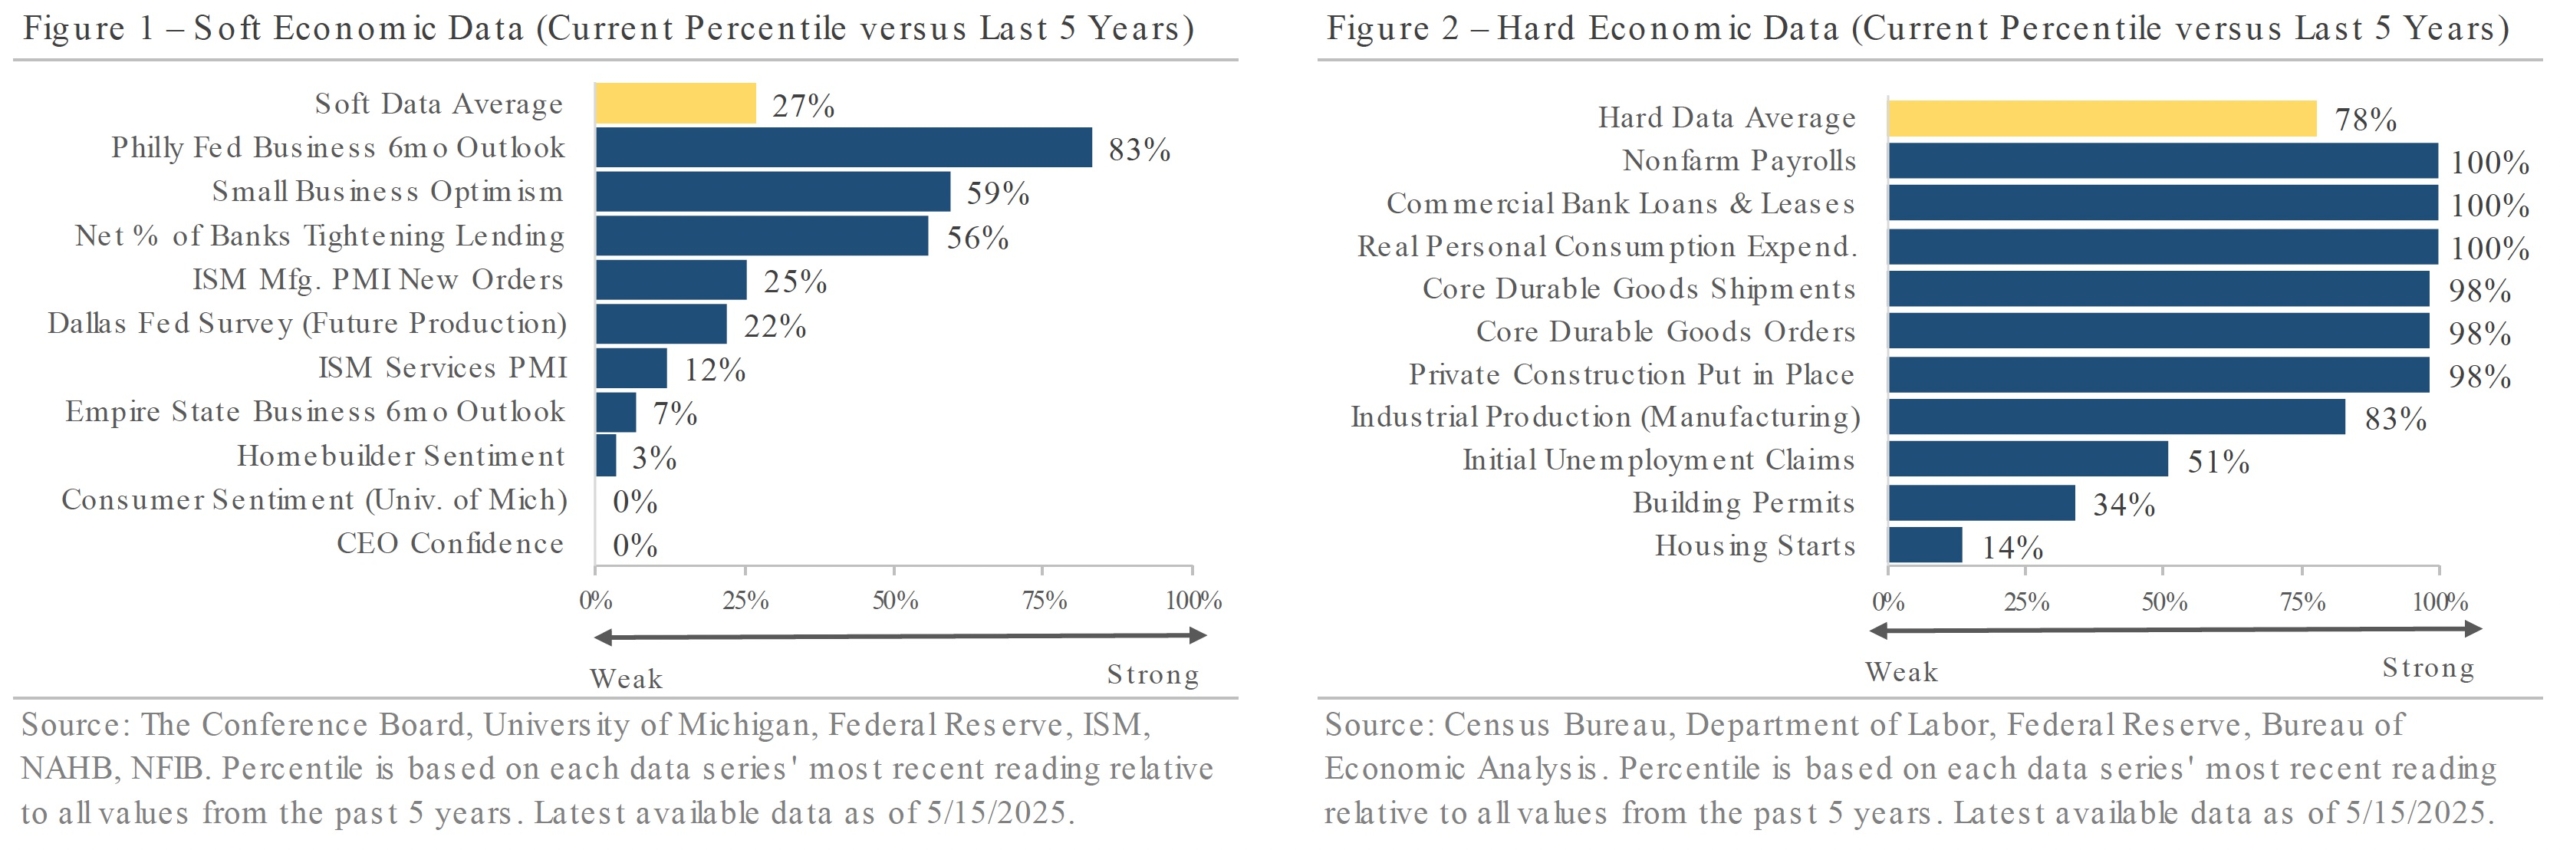
Figure 1 ranks ten soft economic indicators as a percentile relative to the past five years. The yellow bar shows the average soft dataset ranks in the 27th percentile, highlighting broad-based weakness in sentiment and expectations. Starting at the bottom, consumer sentiment and CEO confidence surveys rank in the 0 percentile, reflecting increased uncertainty. In the housing market, builder sentiment is weak as high mortgage rates and home prices weigh on home demand. Further up the list, the Dallas and New York Fed surveys reinforce the cautious business outlook. The Philadelphia Fed survey at the top appears notably less optimistic than the other two surveys, but it’s important to note that the Philadelphia survey was conducted in early May, after the 90-day tariff pause was announced. The divergence is a good example of how quickly soft data can change in response to new information. Bank lending standards and small business optimism are also near the top and appear to be outliers, but that is because they have both recovered from weaker periods in 2022-2023, when the Fed was raising interest rates.
In contrast, Figure 2 tells a more optimistic story based on ten hard economic indicators. The yellow bar shows an average rank in the 78th percentile, signaling continued economic growth. At the top, company payrolls, bank lending, and consumer spending all rank in the 100th percentile, reflecting steady job growth, active credit markets, and solid consumer spending. Manufacturing and industrial data, along with construction activity, are also strong, with durable goods orders and shipments and construction spending all in the 98th percentile. Moving toward the bottom, we start to see areas of softness. Jobless claims rank in the 51st percentile, with unemployment claims still low but rising. In the housing market, building permits and housing starts show the pace of activity continues to slow from pandemic highs.
The data tells a mixed story: soft data indicates sentiment is cautious, while hard data shows actual economic activity remains solid. Both types of data are valuable, but it’s important to understand their uses and limitations. Soft data can influence sentiment and behavior, but hard data ultimately drives corporate earnings and economic growth. Soft data is like next week’s weather forecast. It gives you a sense of what to expect, but it’s not always accurate. Hard data is like looking out the window. It tells you what’s happening now. Given how quickly conditions are changing, our team is tracking both datasets to keep a clear view of the economy.
Important Disclosures
This client letter is being furnished by QuadCap Wealth Management, LLC (“QuadCap”) on a confidential basis for the exclusive use of clients of QuadCap. and may not be disseminated, communicated, reproduced, redistributed or otherwise disclosed by the recipient to any other person without the prior written consent of QuadCap.
This document does not constitute an offer, solicitation or recommendation to sell or an offer to buy any securities, investment products or investment advisory services. Such an offer may only be made to prospective investors by means of delivery of an investment advisory agreement, subscription agreement and other similar materials that contain a description of the material terms relating to such investment, investment strategy or service. This presentation is being provided for general informational purposes only.
This presentation includes information based on data found in independent industry publications and other sources and is current as of the date of this presentation. Although we believe that the data are reliable, we have not sought, nor have we received, permission from any third-party to include their information in this presentation. Charts, tables and graphs contained in this document are not intended to be used to assist the reader in determining which securities to buy or sell or when to buy or sell securities. Opinions, estimates, and projections constitute the current judgment of QuadCap and are subject to change without notice.
References to any indices are for informational and general comparative purposes only. There are significant differences between such indices and the investment programs described in this presentation. References to indices do not suggest that the investment programs will, or are likely to, achieve returns, volatility, or other results similar to such indices. The performance data of various indices presented herein was current as of the date of the presentation.
Past performance is not indicative of future results and there can be no assurance that the future performance of any specific investment or investment strategy will be profitable or equal any corresponding index or benchmark.
Advisory Services are offered through QuadCap, an SEC registered investment advisor. QuadCap only transacts business in states where it is properly registered or is excluded or exempted from registration requirements. SEC registration is not an endorsement of the firm by the Commission and does not mean that QuadCap has attained a specific level of skill or ability.