

The Market Navigates Economic and Policy Uncertainty in February
February Market Summary
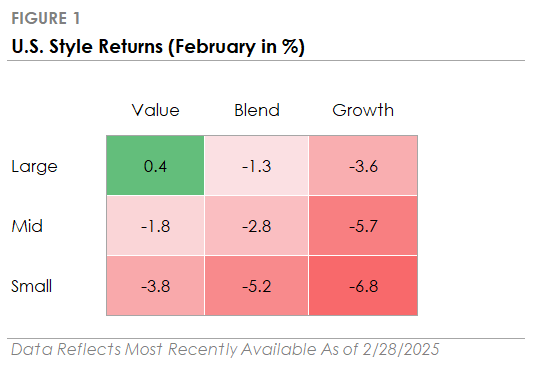
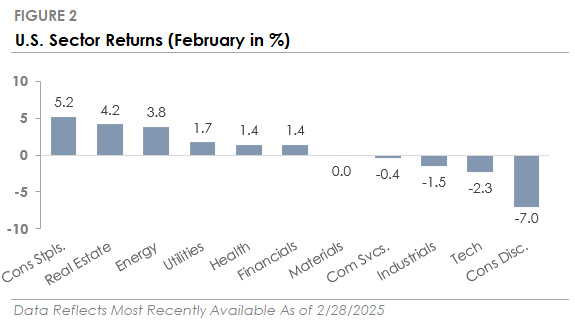
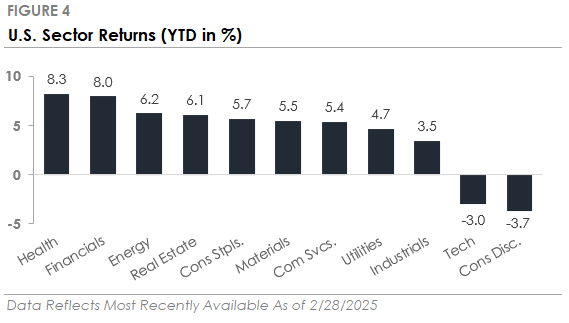
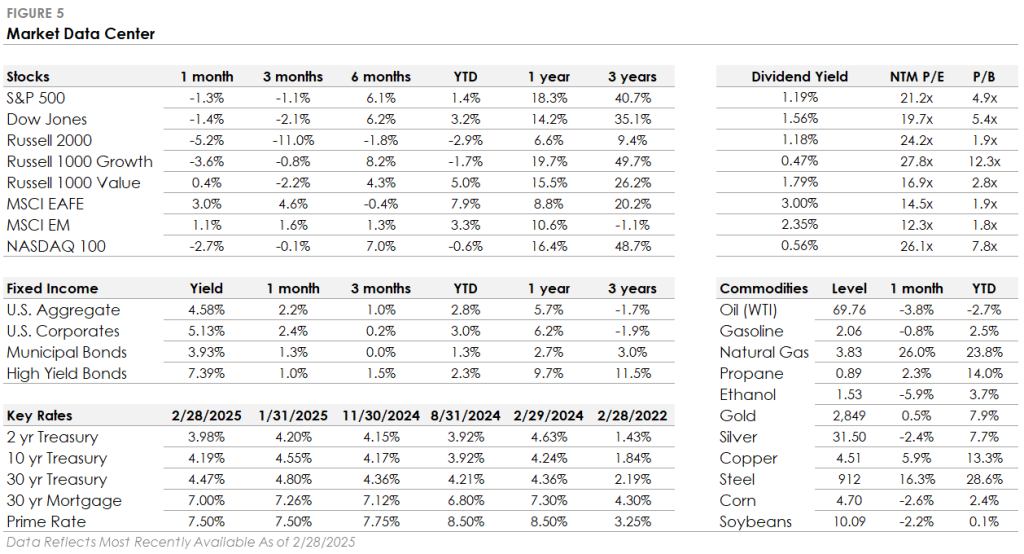
- The S&P 500 Index returned -1.3%, outperforming the Russell 2000 Index’s -5.2% return. Six of the eleven S&P 500 sectors traded higher, led by defensive sectors.
- Bonds traded higher, with the U.S. Bond Aggregate delivering a +2.2% total return. Corporate investment-grade bonds produced a +2.4% total return as Treasury yields declined, outperforming corporate high-yield’s +1.0% total return.
- International stocks traded higher and outperformed the S&P 500. Developed Markets gained +3.0%, led by Europe, while Emerging Markets returned +1.1%.
Stocks and Bonds Move in Opposite Directions Amid Market Rotation
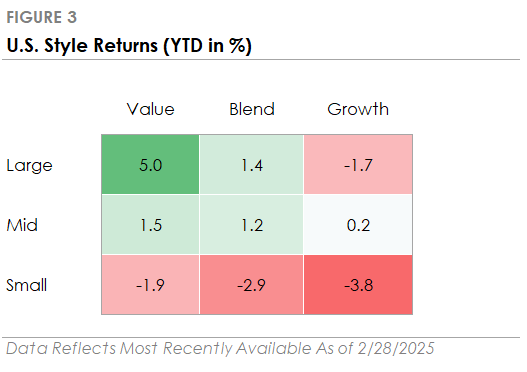
While the stock market experienced a late-month dip, with the S&P 500 retracing some of its post-election gains, it’s important to remember that market fluctuations are a natural part of markets. Beneath the surface, the January market rotation continued as last year’s outperformers lagged. The Magnificent 7, fell by -8% and dragged down the Nasdaq 100, the Large Cap Growth factor, and the S&P 500. In contrast, defensive sectors and international stocks traded higher. In the bond market, Treasury yields declined, with the 10-year yield falling to its lowest level since early December. The decline in interest rates caused bonds to rise, partially offsetting the stock market sell-off. This environment emphasizes the importance of a well-diversified portfolio in navigating market volatility and achieving long-term financial goals.
Economic Growth Holds Steady, but Market Reacts to High Expectations
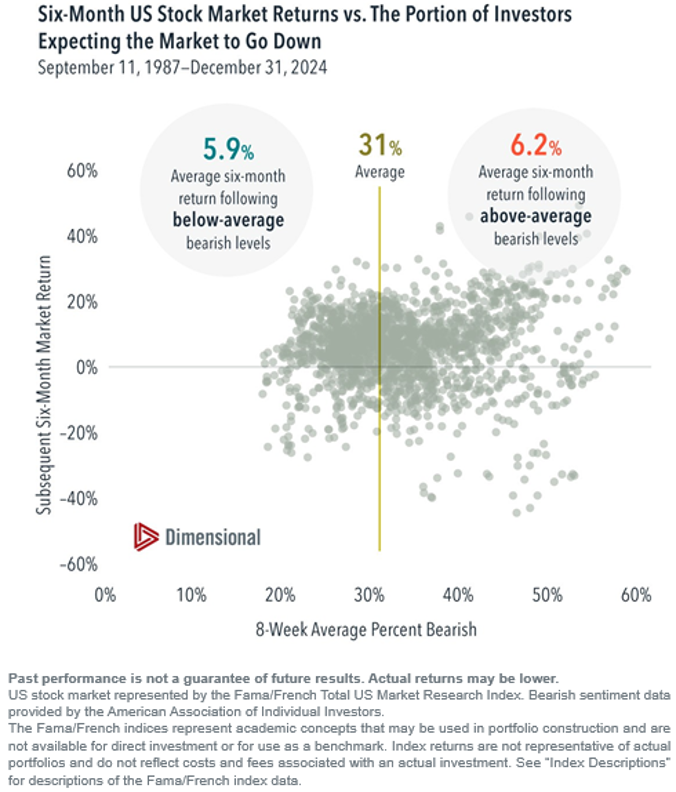
The sell-off wasn’t triggered by a single event or data point but by a combination of interconnected factors. A policy-induced shift in sentiment has contributed to this current market unwind, specifically renewed tariff threats against key trading partners and DOGE spending cuts. Sentiment shifts usually turn out to be buying opportunities in hindsight, as highlighted by the chart below. The primary cause of a shift in sentiment: imposing tariffs and reducing government spending could slow economic growth. But to be clear, slow(er) economic growth does not mean the economy will enter a recession. During the 2010s, US GDP growth was in the low to mid 2% range and the S&P 500 still grew at an annualized rate of 13.3% inclusive of dividends.
Market Sentiment Shifts from Growth to Caution in February
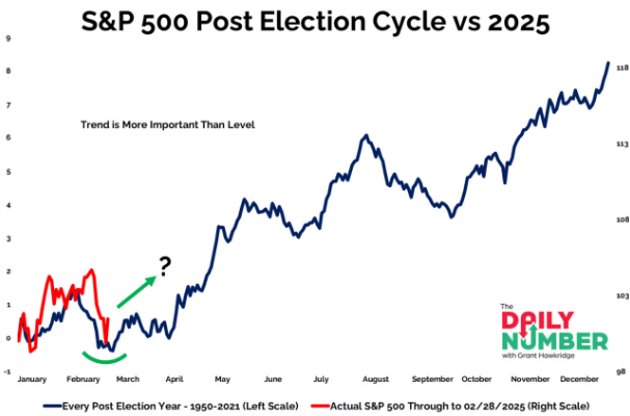
Following the election, the market initially focused on the incoming administration’s pro-growth policies. Expectations for tax cuts, deregulation, and increased energy production fueled hopes for stronger U.S. economic growth. At the start of the year, investors were optimistic about a “Goldilocks” scenario—moderate growth, cooling inflation, and lower interest rates. The optimism propelled stocks to new record highs at the start of the year. With all the new policy changes coming down the pike, the uncertainty in the market is giving investors pause. Historically, the first quarter of a new presidential term can bring increased volatility as the market reorients to a new administration’s policy objectives before “settling down”. Longer term, indicators of earnings growth and labor market health remain positive.
This Month in Numbers
Past performance is not indicative of future results and can be no assurance that future performance of any specific investment or investment strategy will be profitable or equal any corresponding index or benchmark. View full disclosures below.
Published by Market Desk Research and distributed by QuadCap Wealth Management, LLC.
This client letter is being furnished by QuadCap Wealth Management, LLC (“QuadCap”) on a confidential basis for the exclusive use of clients of QuadCap. and may not be disseminated, communicated, reproduced, redistributed or otherwise disclosed by the recipient to any other person without the prior written consent of QuadCap.
This document does not constitute an offer, solicitation or recommendation to sell or an offer to buy any securities, investment products or investment advisory services. Such an offer may only be made to prospective investors by means of delivery of an investment advisory agreement, subscription agreement and other similar materials that contain a description of the material terms relating to such investment, investment strategy or service. This presentation is being provided for general informational purposes only.
This presentation includes information based on data found in independent industry publications and other sources and is current as of the date of this presentation. Although we believe that the data are reliable, we have not sought, nor have we received, permission from any third-party to include their information in this presentation. Charts, tables and graphs contained in this document are not intended to be used to assist the reader in determining which securities to buy or sell or when to buy or sell securities. Opinions, estimates, and projections constitute the current judgment of QuadCap and are subject to change without notice.
References to any indices are for informational and general comparative purposes only. There are significant differences between such indices and the investment programs described in this presentation. References to indices do not suggest that the investment programs will, or are likely to, achieve returns, volatility, or other results similar to such indices. The performance data of various indices presented herein was current as of the date of the presentation.
Past performance is not indicative of future results and there can be no assurance that the future performance of any specific investment or investment strategy will be profitable or equal any corresponding index or benchmark.
Advisory Services are offered through QuadCap, an SEC registered investment advisor. QuadCap only transacts business in states where it is properly registered or is excluded or exempted from registration requirements. SEC registration is not an endorsement of the firm by the Commission and does not mean that QuadCap has attained a specific level of skill or ability.
The S&P 500 Index or Standard & Poor’s 500 Index is a market-capitalization-weighted index of 500 leading publicly traded companies in the U.S.
The Russell 2000 index measures the performance of approximately 2,000 small-cap US equities.
The MSCI EAFE Index is a stock market index that measures the performance of large- and mid-cap companies across 21 developed markets countries around the world. Canada and the USA are not included.
The MSCI Emerging Markets Index captures large and mid cap representation across 24 Emerging Markets (EM) countries.
The Nasdaq 100 Index is a stock index of the 100 largest companies by modified market capitalization trading on Nasdaq exchanges.
The Russell 1000 Growth index is an index that tracks large cap, growth stocks. This benchmark is important for investors that might tilt their investments towards large cap growth. Growth stocks, in comparison to value stocks, are considered companies with a more growth potential, and a higher risk profile.
The Russell 1000 Value index is an index that tracks large cap, value stocks. This benchmark is important for investors that might tilt their investments towards large cap value. Value stocks, in comparison to growth stocks, are considered companies with a stable cash flow, and more mature business model.
The Dow Jones Industrial Average, or simply the Dow, is a stock market index that indicates the value of 30 large, publicly owned companies based in the United States, and how they have traded in the stock market during various periods of time. These 30 companies are also included in the S&P 500 Index. The value of the Dow is not a weighted arithmetic mean and does not represent its component companies’ market capitalization, but rather the sum of the price of one share of stock for each component company. The sum is corrected by a factor which changes whenever one of the component stocks has a stock split or stock dividend, so as to generate a consistent value for the index.
The Bloomberg US Aggregate Bond Index is used as a benchmark for investment grade bonds within the United States. This index is important as a benchmark for someone wanting to track their fixed income asset allocation.
The Bloomberg US Corporate Index covers performance for United States corporate bonds. This index serves as an important benchmark for portfolios that include exposure to investment grade corporate bonds.
The Bloomberg US Corporate High Yield Index covers performance for United States high yield corporate bonds. This index serves as an important benchmark for portfolios that include exposure to riskier corporate bonds that might not necessarily be investment grade.
Treasuries, also known as Treasury securities, are debt obligations issued by the United States government. They are used to raise cash needed to fund government operations and help finance the federal deficit. Treasuries are backed by the full faith and credit of the US government, making them one of the safest investments. They are an important instrument in monetary policy, allowing central banks to control the money supply.
The Prime Rate is the interest rate that commercial banks charge their most creditworthy corporate customers. The prime rate is derived from the federal funds rate, usually using fed funds + 3 as the formula.