

Federal Reserve Set to Begin Cutting Interest Rates in September
Monthly Market Summary
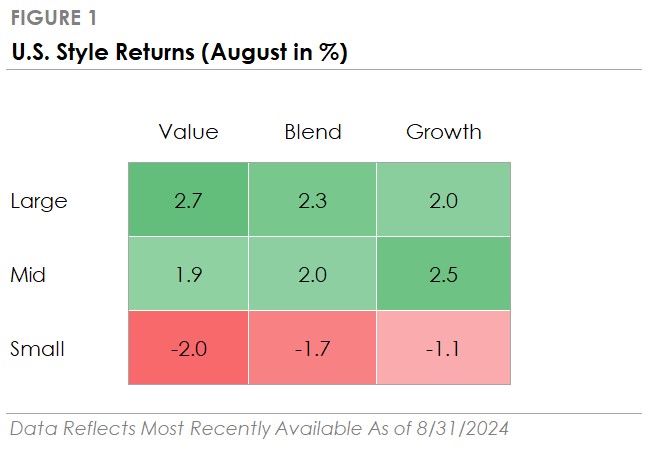
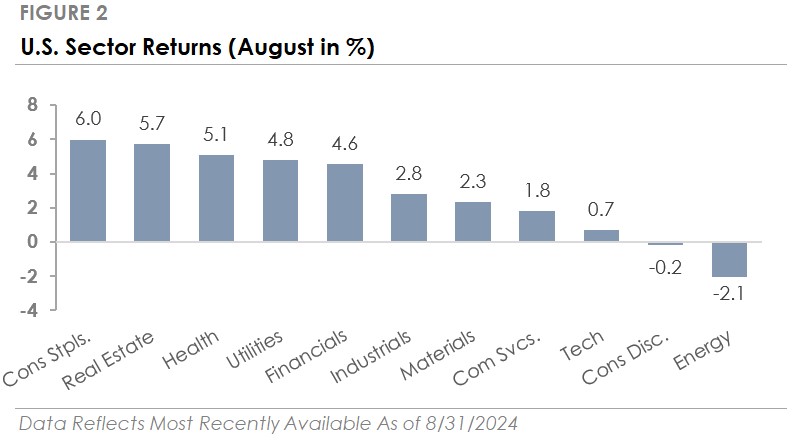
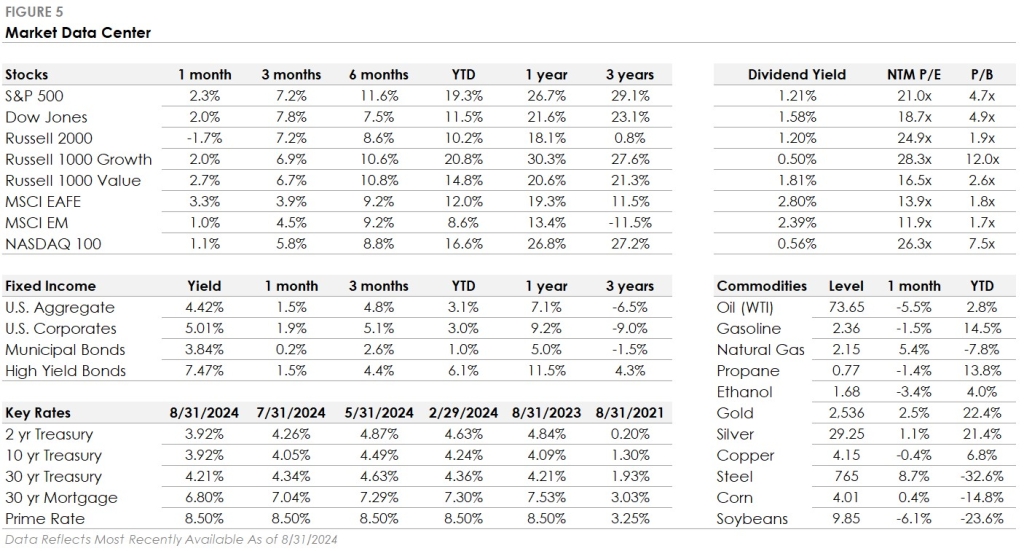
- The S&P 500 Index returned +2.3% in August, outperforming the Russell 2000 Index’s -1.7% return. Nine of the eleven S&P 500 sectors traded higher, led by Consumer Staples, Real Estate, Health Care, and Utilities.
- Corporate investment-grade bonds produced a +1.9% total return as Treasury yields declined, slightly outperforming corporate high-yield’s +1.5% total return.
- International stock performance was mixed. The MSCI EAFE developed market stock index returned +3.3% and outperformed the S&P 500, while the MSCI Emerging Market Index returned +1.0%.
Stocks Rebound Following an Early-Month Selloff
Stocks traded higher in August despite an early-month selloff. The S&P 500 dropped over -5% in the first week after a report showed unemployment rose to 4.3% in July. Small-cap stocks underperformed as investors pulled back from riskier assets amid volatility. However, financial markets quickly stabilized and climbed throughout the month. The S&P 500 recovered all its losses, ending the month less than -1% below its all-time high from mid-July. The Nasdaq 100 Index, which includes the artificial intelligence companies that drove the stock market higher in early 2024, lagged the broader market.
In the bond market, Treasury yields fell for the second consecutive month, driven by expectations for deeper rate cuts in response to rising unemployment. Bonds traded higher for a fourth consecutive month as Treasury yields declined and investors rushed to lock in current fixed income yields ahead of the first interest rate cut.
Fed Set to Cut Interest Rates as Focus Shifts to the Labor Market
Investors expect the Federal Reserve to start cutting interest rates at its next meeting on September 17th. Fed Chair Jerome Powell signaled the move at last month’s Jackson Hole conference, saying, “The time has come for policy to adjust. The direction of travel is clear, and the timing and pace of rate cuts will depend on incoming data, the evolving outlook and the balance of risks.” It was the Fed’s clearest policy signal since it last raised interest rates 14 months ago.
The Fed’s transition to cutting interest rates comes as its focus shifts from lowering inflation to supporting the labor market. Since the last rate hike in July 2023, inflation has dropped from 3.3% to 2.9%, while unemployment has risen from 3.5% to 4.3%. The Fed is now more confident that inflation will continue to cool towards its 2% target and is turning its attention to the overall health of the U.S. labor market. The key question is how much and how quickly the Fed will lower interest rates. Investors anticipate the Fed will cut rates by approximately -2% through the end of 2025, but the timing and amount will depend on the economy’s path.
This Month in Numbers
Important Disclosures
Published by Market Desk Research and distributed by QuadCap Wealth Management, LLC.
This client letter is being furnished by QuadCap Wealth Management, LLC (“QuadCap”) on a confidential basis for the exclusive use of clients of QuadCap. and may not be disseminated, communicated, reproduced, redistributed or otherwise disclosed by the recipient to any other person without the prior written consent of QuadCap.
This document does not constitute an offer, solicitation or recommendation to sell or an offer to buy any securities, investment products or investment advisory services. Such an offer may only be made to prospective investors by means of delivery of an investment advisory agreement, subscription agreement and other similar materials that contain a description of the material terms relating to such investment, investment strategy or service. This presentation is being provided for general informational purposes only.
This presentation includes information based on data found in independent industry publications and other sources and is current as of the date of this presentation. Although we believe that the data are reliable, we have not sought, nor have we received, permission from any third-party to include their information in this presentation. Charts, tables and graphs contained in this document are not intended to be used to assist the reader in determining which securities to buy or sell or when to buy or sell securities. Opinions, estimates, and projections constitute the current judgment of QuadCap and are subject to change without notice.
References to any indices are for informational and general comparative purposes only. There are significant differences between such indices and the investment programs described in this presentation. References to indices do not suggest that the investment programs will, or are likely to, achieve returns, volatility, or other results similar to such indices. The performance data of various indices presented herein was current as of the date of the presentation.
Past performance is not indicative of future results and there can be no assurance that the future performance of any specific investment or investment strategy will be profitable or equal any corresponding index or benchmark.
Advisory Services are offered through QuadCap, an SEC registered investment advisor. QuadCap only transacts business in states where it is properly registered or is excluded or exempted from registration requirements. SEC registration is not an endorsement of the firm by the Commission and does not mean that QuadCap has attained a specific level of skill or ability.
The S&P 500 Index or Standard & Poor’s 500 Index is a market-capitalization-weighted index of 500 leading publicly traded companies in the U.S.
The Russell 2000 index measures the performance of approximately 2,000 small-cap US equities.
The MSCI EAFE Index is a stock market index that measures the performance of large- and mid-cap companies across 21 developed markets countries around the world. Canada and the USA are not included.
The MSCI Emerging Markets Index captures large and mid cap representation across 24 Emerging Markets (EM) countries.
The Nasdaq 100 Index is a stock index of the 100 largest companies by modified market capitalization trading on Nasdaq exchanges.
The Russell 1000 Growth index is an index that tracks large cap, growth stocks. This benchmark is important for investors that might tilt their investments towards large cap growth. Growth stocks, in comparison to value stocks, are considered companies with a more growth potential, and a higher risk profile.
The Russell 1000 Value index is an index that tracks large cap, value stocks. This benchmark is important for investors that might tilt their investments towards large cap value. Value stocks, in comparison to growth stocks, are considered companies with a stable cash flow, and more mature business model.
The CBOE VIX Index is a calculation designed to produce a measure of constant, 30-day expected volatility of the U.S. stock market, derived from real-time, mid-quote prices of S&P 500® Index (SPX℠) call and put options.
The Magnificent 7 is a group of major tech companies with stock growth that, on average, far outpaced the high-performing S&P 500® in recent years.
Coined in 2023, the group consists of Alphabet, Amazon, Apple, Meta Platforms, Microsoft, Nvidia, and Tesla.
The Dow Jones Industrial Average, or simply the Dow, is a stock market index that indicates the value of 30 large, publicly owned companies based in the United States, and how they have traded in the stock market during various periods of time. These 30 companies are also included in the S&P 500 Index. The value of the Dow is not a weighted arithmetic mean and does not represent its component companies’ market capitalization, but rather the sum of the price of one share of stock for each component company. The sum is corrected by a factor which changes whenever one of the component stocks has a stock split or stock dividend, so as to generate a consistent value for the index.
The Bloomberg US Aggregate Bond Index is used as a benchmark for investment grade bonds within the United States. This index is important as a benchmark for someone wanting to track their fixed income asset allocation.
The Bloomberg US Corporate Index covers performance for United States corporate bonds. This index serves as an important benchmark for portfolios that include exposure to investment grade corporate bonds.
The Bloomberg US Corporate High Yield Index covers performance for United States high yield corporate bonds. This index serves as an important benchmark for portfolios that include exposure to riskier corporate bonds that might not necessarily be investment grade.
Treasuries, also known as Treasury securities, are debt obligations issued by the United States government. They are used to raise cash needed to fund government operations and help finance the federal deficit. Treasuries are backed by the full faith and credit of the US government, making them one of the safest investments. They are an important instrument in monetary policy, allowing central banks to control the money supply.
The Prime Rate is the interest rate that commercial banks charge their most creditworthy corporate customers. The prime rate is derived from the federal funds rate, usually using fed funds + 3 as the formula.