

The Stock Market Experienced a Big Rotation in July
Monthly Market Summary
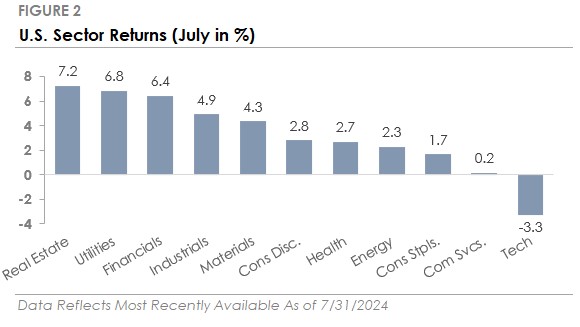
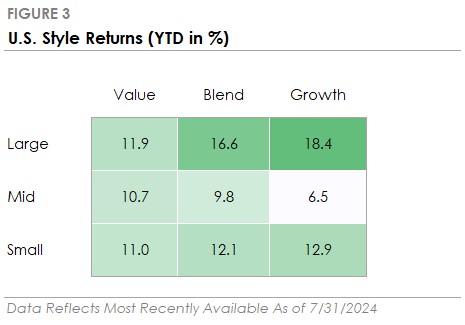
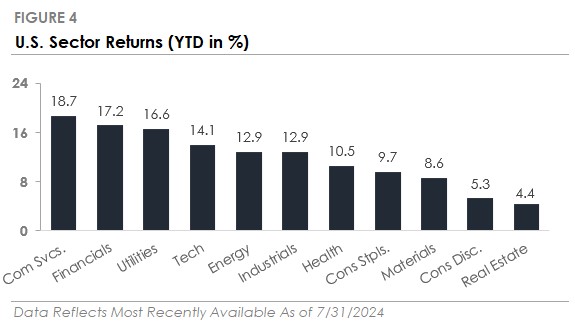
- The S&P 500 Index returned +1.2% in July, underperforming the Russell 2000 Index’s +10.3% return. Ten of the eleven S&P 500 sectors traded higher, led by Real Estate, Utilities, and Financials. Technology was the only sector to trade lower, reversing a portion of its rise in the first half of 2024.
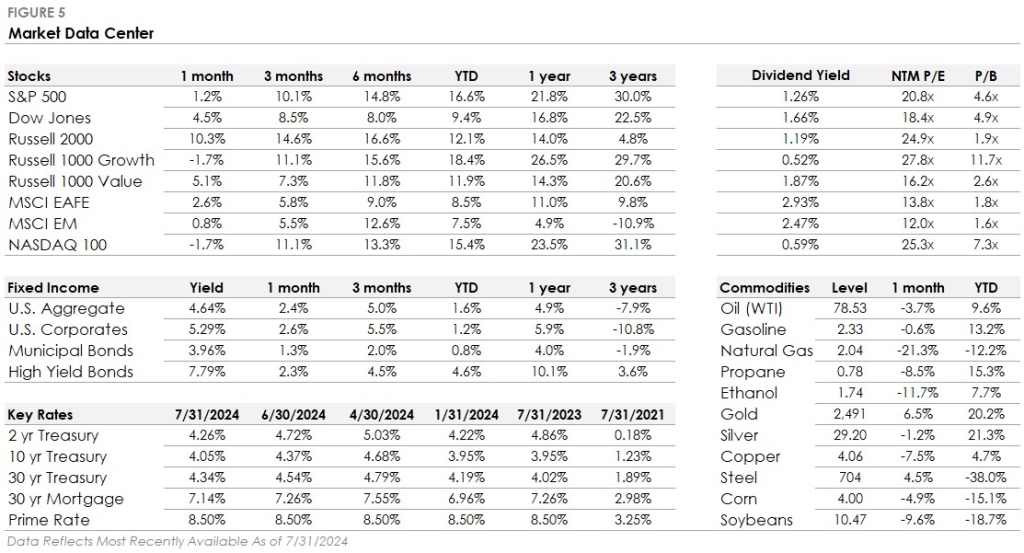
- Corporate investment-grade bonds produced a +2.6% total return as Treasury yields declined. Corporate high-yield bonds gained +2.3% as credit spreads tightened.
- International stock performance was mixed. The MSCI EAFE developed market stock index returned +2.6%, while the MSCI Emerging Market Index returned +0.8%.
Stocks & Bonds End the Month Slightly Higher
The S&P 500 ended July slightly higher, its third consecutive monthly gain. The index initially traded higher and briefly surpassed 5,600 for the first time before it traded lower in late July and gave back some of the gains. The tech-heavy Nasdaq 100, which led markets higher in 1H 2024, returned -1.7% as Nvidia, Microsoft, Google, and Facebook-parent Meta traded down after their strong 2024 start. In contrast, the Russell 2000 Index of small-cap stocks posted its highest monthly return since December 2023. In the bond market, Treasury yields fell. The U.S. Bond Aggregate Index, which tracks a wide array of investment-grade bonds, traded higher for a third consecutive month, the longest win streak since 2021. Despite the muted headline returns, the stock market experienced a seismic shift as expectations increased for a September interest rate cut.
Investors Rotate into Small Cap Stocks as Rate Cuts Come into View
Large-cap stocks dominated in the first half of 2024, with the S&P 500 outperforming the Russell 2000 by over +13%. The S&P 500’s first-half return was influenced by two factors: (1) investor concerns about the impact of high interest rates on smaller companies and (2) large-cap stock indices’ exposure to the artificial intelligence (AI) industry. This combination of interest rate concerns and AI dominance led to crowded positioning as investors focused on a narrow group of large-cap stocks. The investment narrative changed in July after the CPI inflation report showed continued progress. The better-than-expected inflation report raised expectations for a September interest rate cut, leading to a significant rotation within equity markets. Investors moved from large-cap stocks into small-caps, with the Russell 2000 outperforming the S&P 500 by over +9%.
Dropping the Baton (sorry – we had to do it!)
As the Russell 2000 rallied last month, large-caps stumbled. Mega-caps bore the brunt of the sell-off as investors questioned when billions of dollars in AI investments would pay off. As investors rotated, the year-to-date return gap between the Nasdaq 100 and Russell 2000 shrank from nearly +16% at the end of June to only +3.3%. It’s a healthy reminder that markets do not rise in a straight line.
August tends to be seasonally choppy as investors return from their summer vacations to assess their portfolios for the remainder of the year. The past week’s volatility has left many to speculate on the cause(s). Over the week, we heard many plausible explanations: jobs data, inflation data, interest rates, U.S. politics, geopolitics, and 2nd quarter earnings. This volatility may be the culmination of those factors above. Still, many of them were known and thus, should have been priced in by the markets. More likely, given the viciousness of the sell-off, is a broader deleveraging event (i.e., forced liquidations) as the Japanese Yen (stronger) has rallied over 13% against the U.S. Dollar (weaker). This phenomenon is known as a “Carry Trade,” while they’re rare, they can catch the market flat-footed. A carry trade involves borrowing from a country with low interest rates and a weak currency (Japan) and reinvesting the money in assets of another country with a higher return, such as U.S. equities. Investors can be forced to liquidate the trade when the stability of that foreign-exchange rate (YEN/USD) disappears, and the borrowing currency increases rapidly.
When traders choose to liquidate quickly, they sell the most liquid assets with the highest prior returns. The bottom line is that global stock markets are very interconnected in today’s world. Stock market moves are no longer localized; an event halfway around the world can impact U.S. stock markets.
Moving Forward and Hopefully, Higher
The U.S. economy is estimated to have grown at a +2.8% pace in Q2 2024, and initial jobless claims are very low by historical standards. The Fed’s real-time Weekly Economic Index signals that the economy is still growing around 2%, and it uses high-frequency data to measure growth in real-time.
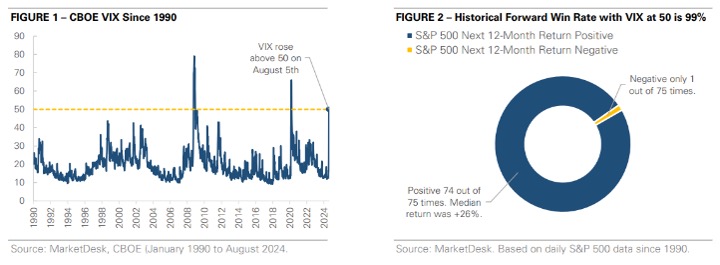
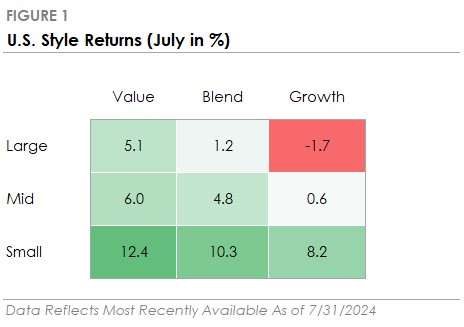
The equity market’s path forward is uncertain, and our focus will be on whether investors buy the dip (section 7 in the August Roundup). Market dynamics, particularly the VIX, suggest the market may be near a significant turning point. The VIX briefly traded above 50, a level not seen since March 2020. Statistically, a rise above 50 is very bullish for forward returns. Since 1990, the CBOE VIX has only risen above 50 seventy-five times. Over the next 12 months, the S&P 500 traded higher 74 of those 75 times, a 98%-win rate. Continue to expect elevated volatility in the near term as the “known unknowns” remain top of mind for the market.
Annual returns and intra-year declines

Source: FactSet, Standard & Poor’s, J.P. Morgan Asset Management.
Returns are based on price index only and do not include dividends. Intra-year drops refers to the largest market drops from a peak to a trough during the year. For illustrative purposes only. Returns shown are calendar year returns from 1980 to 2023, over which time period the average annual return was 10.3%.
Guide to the Markets – U.S. Data are as of July 31, 2024.
This Month in Numbers
Important Disclosures
Published by Market Desk Research and distributed by QuadCap Wealth Management, LLC.
This client letter is being furnished by QuadCap Wealth Management, LLC (“QuadCap”) on a confidential basis for the exclusive use of clients of QuadCap. and may not be disseminated, communicated, reproduced, redistributed or otherwise disclosed by the recipient to any other person without the prior written consent of QuadCap.
This document does not constitute an offer, solicitation or recommendation to sell or an offer to buy any securities, investment products or investment advisory services. Such an offer may only be made to prospective investors by means of delivery of an investment advisory agreement, subscription agreement and other similar materials that contain a description of the material terms relating to such investment, investment strategy or service. This presentation is being provided for general informational purposes only.
This presentation includes information based on data found in independent industry publications and other sources and is current as of the date of this presentation. Although we believe that the data are reliable, we have not sought, nor have we received, permission from any third-party to include their information in this presentation. Charts, tables and graphs contained in this document are not intended to be used to assist the reader in determining which securities to buy or sell or when to buy or sell securities. Opinions, estimates, and projections constitute the current judgment of QuadCap and are subject to change without notice.
References to any indices are for informational and general comparative purposes only. There are significant differences between such indices and the investment programs described in this presentation. References to indices do not suggest that the investment programs will, or are likely to, achieve returns, volatility, or other results similar to such indices. The performance data of various indices presented herein was current as of the date of the presentation.
Past performance is not indicative of future results and there can be no assurance that the future performance of any specific investment or investment strategy will be profitable or equal any corresponding index or benchmark.
Advisory Services are offered through QuadCap, an SEC registered investment advisor. QuadCap only transacts business in states where it is properly registered or is excluded or exempted from registration requirements. SEC registration is not an endorsement of the firm by the Commission and does not mean that QuadCap has attained a specific level of skill or ability.
The S&P 500 Index or Standard & Poor’s 500 Index is a market-capitalization-weighted index of 500 leading publicly traded companies in the U.S.
The Russell 2000 index measures the performance of approximately 2,000 small-cap US equities.
The MSCI EAFE Index is a stock market index that measures the performance of large- and mid-cap companies across 21 developed markets countries around the world. Canada and the USA are not included.
The MSCI Emerging Markets Index captures large and mid cap representation across 24 Emerging Markets (EM) countries.
The Nasdaq 100 Index is a stock index of the 100 largest companies by modified market capitalization trading on Nasdaq exchanges.
The Russell 1000 Growth index is an index that tracks large cap, growth stocks. This benchmark is important for investors that might tilt their investments towards large cap growth. Growth stocks, in comparison to value stocks, are considered companies with a more growth potential, and a higher risk profile.
The Russell 1000 Value index is an index that tracks large cap, value stocks. This benchmark is important for investors that might tilt their investments towards large cap value. Value stocks, in comparison to growth stocks, are considered companies with a stable cash flow, and more mature business model.
The CBOE VIX Index is a calculation designed to produce a measure of constant, 30-day expected volatility of the U.S. stock market, derived from real-time, mid-quote prices of S&P 500® Index (SPX℠) call and put options.
The Magnificent 7 is a group of major tech companies with stock growth that, on average, far outpaced the high-performing S&P 500® in recent years.
Coined in 2023, the group consists of Alphabet, Amazon, Apple, Meta Platforms, Microsoft, Nvidia, and Tesla.
The Dow Jones Industrial Average, or simply the Dow, is a stock market index that indicates the value of 30 large, publicly owned companies based in the United States, and how they have traded in the stock market during various periods of time. These 30 companies are also included in the S&P 500 Index. The value of the Dow is not a weighted arithmetic mean and does not represent its component companies’ market capitalization, but rather the sum of the price of one share of stock for each component company. The sum is corrected by a factor which changes whenever one of the component stocks has a stock split or stock dividend, so as to generate a consistent value for the index.
The Bloomberg US Aggregate Bond Index is used as a benchmark for investment grade bonds within the United States. This index is important as a benchmark for someone wanting to track their fixed income asset allocation.
The Bloomberg US Corporate Index covers performance for United States corporate bonds. This index serves as an important benchmark for portfolios that include exposure to investment grade corporate bonds.
The Bloomberg US Corporate High Yield Index covers performance for United States high yield corporate bonds. This index serves as an important benchmark for portfolios that include exposure to riskier corporate bonds that might not necessarily be investment grade.
Treasuries, also known as Treasury securities, are debt obligations issued by the United States government. They are used to raise cash needed to fund government operations and help finance the federal deficit. Treasuries are backed by the full faith and credit of the US government, making them one of the safest investments. They are an important instrument in monetary policy, allowing central banks to control the money supply.
The Prime Rate is the interest rate that commercial banks charge their most creditworthy corporate customers. The prime rate is derived from the federal funds rate, usually using fed funds + 3 as the formula.