

Long-Term Perspective: Understanding How Valuations Impact Portfolio Returns
The S&P 500 has rallied +50% since the start of 2023 and more than +150% from the COVID pandemic low in March 2020. The rally has produced a long list of all-time highs and boosted investment portfolios, but it has made broad market indices more expensive. The S&P 500 currently trades at over 21 times its next 12-month earnings estimate, a level not seen outside of periods like the late-1990s tech boom and the recent post-COVID recovery, when interest rates were near zero. Why do high valuations matter? History shows that while valuations have a limited impact on short-term returns, they play a critical role in determining long-term performance.
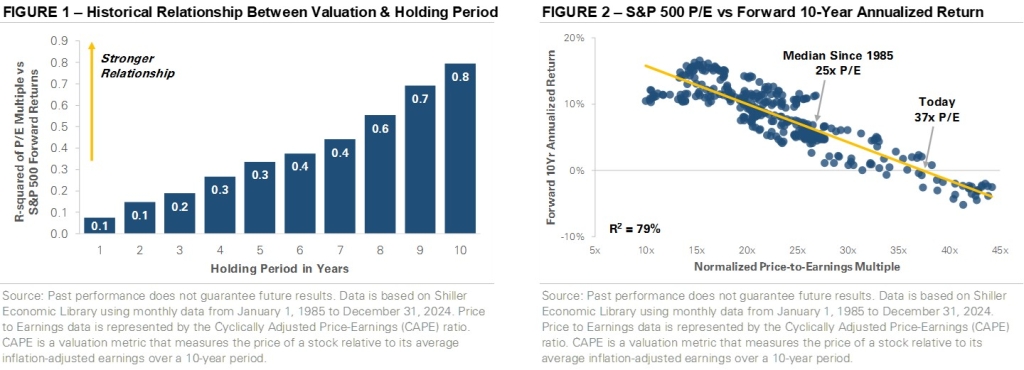
Figure 1 shows the relationship between the S&P 500’s starting valuation and future returns. The horizontal axis represents holding periods in years, and the vertical axis shows the R-squared (R2) between the S&P 500’s starting valuation and its forward return. R2 is a statistical measure that shows the predictiveness between two variables. For example, an R2 of 0.40 indicates that 40% of the changes in one variable can be attributed to changes in the other variable, while the remaining 60% is due to other factors or random variation. The left side of the chart tracks short holding periods of only a few years, revealing a low R2 between valuations and forward returns. The takeaway is that the S&P 500’s starting valuation doesn’t explain a significant portion of its short-term return. However, the R2 increases as you move across the chart, showing that valuation explains a larger portion of longer-term returns. For a 10-year holding period, the S&P 500’s starting valuation explains ~80% of the variability in returns, highlighting valuation’s importance for long-term investors.
Figure 2 expands on the importance of valuations by plotting the S&P 500’s starting valuation against its next 10-year annualized return. The starting valuation represents the S&P 500’s normalized price-to-earnings (P/E) multiple, which is calculated as the current price divided by the average inflation-adjusted earnings over the past ten years. The line slopes from the top left to the bottom right, indicating that as the starting valuation increases, forward returns decrease. The current normalized P/E ratio of 37 times is marked on the chart, suggesting the S&P 500 could produce a low single-digit annualized return over the next ten years.
The previous statement carries significant weight, but it’s important to put context around historical analysis like this. While past performance offers valuable insights, it doesn’t guarantee future outcomes, and timing the market is difficult. Figure 1 shows that valuations aren’t reliable indicators of short-term market returns, and markets can remain expensive longer than expected. However, given the rarity of today’s starting valuation, it’s important to acknowledge the potential impact on forward returns when setting expectations for the years ahead.
Important Disclosures
Published by Market Desk Research and distributed by QuadCap Wealth Management, LLC.
This client letter is being furnished by QuadCap Wealth Management, LLC (“QuadCap”) on a confidential basis for the exclusive use of clients of QuadCap. and may not be disseminated, communicated, reproduced, redistributed or otherwise disclosed by the recipient to any other person without the prior written consent of QuadCap.
This document does not constitute an offer, solicitation or recommendation to sell or an offer to buy any securities, investment products or investment advisory services. Such an offer may only be made to prospective investors by means of delivery of an investment advisory agreement, subscription agreement and other similar materials that contain a description of the material terms relating to such investment, investment strategy or service. This presentation is being provided for general informational purposes only.
This presentation includes information based on data found in independent industry publications and other sources and is current as of the date of this presentation. Although we believe that the data are reliable, we have not sought, nor have we received, permission from any third-party to include their information in this presentation. Charts, tables and graphs contained in this document are not intended to be used to assist the reader in determining which securities to buy or sell or when to buy or sell securities. Opinions, estimates, and projections constitute the current judgment of QuadCap and are subject to change without notice.
References to any indices are for informational and general comparative purposes only. There are significant differences between such indices and the investment programs described in this presentation. References to indices do not suggest that the investment programs will, or are likely to, achieve returns, volatility, or other results similar to such indices. The performance data of various indices presented herein was current as of the date of the presentation.
Past performance is not indicative of future results and there can be no assurance that the future performance of any specific investment or investment strategy will be profitable or equal any corresponding index or benchmark.
Advisory Services are offered through QuadCap, an SEC registered investment advisor. QuadCap only transacts business in states where it is properly registered or is excluded or exempted from registration requirements. SEC registration is not an endorsement of the firm by the Commission and does not mean that QuadCap has attained a specific level of skill or ability.
The S&P 500 Index or Standard & Poor’s 500 Index is a market-capitalization-weighted index of 500 leading publicly traded companies in the U.S.
The Russell 2000 index measures the performance of approximately 2,000 small-cap US equities.
The MSCI EAFE Index is a stock market index that measures the performance of large- and mid-cap companies across 21 developed markets countries around the world. Canada and the USA are not included.
The MSCI Emerging Markets Index captures large and mid cap representation across 24 Emerging Markets (EM) countries.
The Nasdaq 100 Index is a stock index of the 100 largest companies by modified market capitalization trading on Nasdaq exchanges.
The Russell 1000 Growth index is an index that tracks large cap, growth stocks. This benchmark is important for investors that might tilt their investments towards large cap growth. Growth stocks, in comparison to value stocks, are considered companies with a more growth potential, and a higher risk profile.
The Russell 1000 Value index is an index that tracks large cap, value stocks. This benchmark is important for investors that might tilt their investments towards large cap value. Value stocks, in comparison to growth stocks, are considered companies with a stable cash flow, and more mature business model.
The CBOE VIX Index is a calculation designed to produce a measure of constant, 30-day expected volatility of the U.S. stock market, derived from real-time, mid-quote prices of S&P 500® Index (SPX℠) call and put options.
The Magnificent 7 is a group of major tech companies with stock growth that, on average, far outpaced the high-performing S&P 500® in recent years.
Coined in 2023, the group consists of Alphabet, Amazon, Apple, Meta Platforms, Microsoft, Nvidia, and Tesla.
The Dow Jones Industrial Average, or simply the Dow, is a stock market index that indicates the value of 30 large, publicly owned companies based in the United States, and how they have traded in the stock market during various periods of time. These 30 companies are also included in the S&P 500 Index. The value of the Dow is not a weighted arithmetic mean and does not represent its component companies’ market capitalization, but rather the sum of the price of one share of stock for each component company. The sum is corrected by a factor which changes whenever one of the component stocks has a stock split or stock dividend, so as to generate a consistent value for the index.
The Bloomberg US Aggregate Bond Index is used as a benchmark for investment grade bonds within the United States. This index is important as a benchmark for someone wanting to track their fixed income asset allocation.
The Bloomberg US Corporate Index covers performance for United States corporate bonds. This index serves as an important benchmark for portfolios that include exposure to investment grade corporate bonds.
The Bloomberg US Corporate High Yield Index covers performance for United States high yield corporate bonds. This index serves as an important benchmark for portfolios that include exposure to riskier corporate bonds that might not necessarily be investment grade.
Treasuries, also known as Treasury securities, are debt obligations issued by the United States government. They are used to raise cash needed to fund government operations and help finance the federal deficit. Treasuries are backed by the full faith and credit of the US government, making them one of the safest investments. They are an important instrument in monetary policy, allowing central banks to control the money supply.
The Prime Rate is the interest rate that commercial banks charge their most creditworthy corporate customers. The prime rate is derived from the federal funds rate, usually using fed funds + 3 as the formula.